- India
- /
- Personal Products
- /
- NSEI:PGHH
Can You Imagine How Jubilant Procter & Gamble Hygiene and Health Care's (NSE:PGHH) Shareholders Feel About Its 107% Share Price Gain?


When you buy a stock there is always a possibility that it could drop 100%. But on a lighter note, a good company can see its share price rise well over 100%. For example, the Procter & Gamble Hygiene and Health Care Limited (NSE:PGHH) share price has soared 107% in the last half decade. Most would be very happy with that. On top of that, the share price is up 14% in about a quarter. But this move may well have been assisted by the reasonably buoyant market (up 14% in 90 days).
Check out our latest analysis for Procter & Gamble Hygiene and Health Care
There is no denying that markets are sometimes efficient, but prices do not always reflect underlying business performance. By comparing earnings per share (EPS) and share price changes over time, we can get a feel for how investor attitudes to a company have morphed over time.
During five years of share price growth, Procter & Gamble Hygiene and Health Care achieved compound earnings per share (EPS) growth of 10% per year. This EPS growth is lower than the 16% average annual increase in the share price. So it's fair to assume the market has a higher opinion of the business than it did five years ago. That's not necessarily surprising considering the five-year track record of earnings growth. This optimism is visible in its fairly high P/E ratio of 63.29.
You can see below how EPS has changed over time (discover the exact values by clicking on the image).
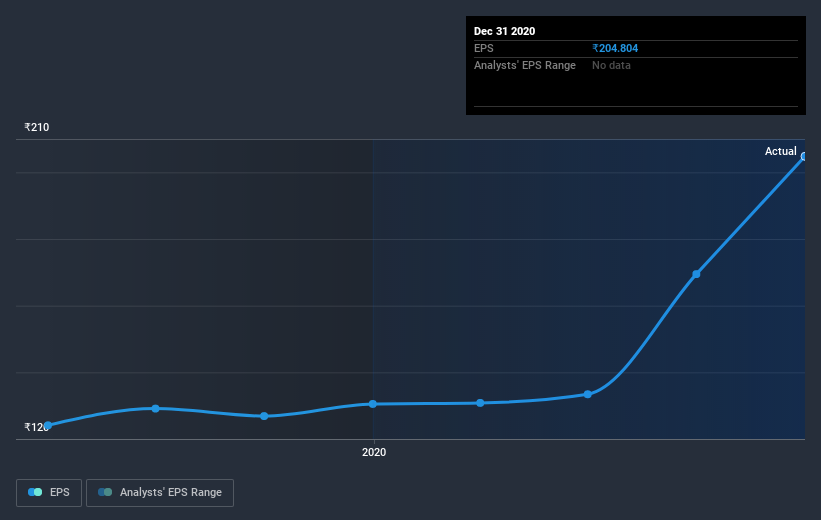
Dive deeper into Procter & Gamble Hygiene and Health Care's key metrics by checking this interactive graph of Procter & Gamble Hygiene and Health Care's earnings, revenue and cash flow.
What About Dividends?
It is important to consider the total shareholder return, as well as the share price return, for any given stock. Whereas the share price return only reflects the change in the share price, the TSR includes the value of dividends (assuming they were reinvested) and the benefit of any discounted capital raising or spin-off. Arguably, the TSR gives a more comprehensive picture of the return generated by a stock. In the case of Procter & Gamble Hygiene and Health Care, it has a TSR of 125% for the last 5 years. That exceeds its share price return that we previously mentioned. The dividends paid by the company have thusly boosted the total shareholder return.
A Different Perspective
Procter & Gamble Hygiene and Health Care shareholders are up 30% for the year (even including dividends). But that was short of the market average. On the bright side, that's still a gain, and it's actually better than the average return of 18% over half a decade This suggests the company might be improving over time. I find it very interesting to look at share price over the long term as a proxy for business performance. But to truly gain insight, we need to consider other information, too. For example, we've discovered 1 warning sign for Procter & Gamble Hygiene and Health Care that you should be aware of before investing here.
If you would prefer to check out another company -- one with potentially superior financials -- then do not miss this free list of companies that have proven they can grow earnings.
Please note, the market returns quoted in this article reflect the market weighted average returns of stocks that currently trade on IN exchanges.
If you decide to trade Procter & Gamble Hygiene and Health Care, use the lowest-cost* platform that is rated #1 Overall by Barron’s, Interactive Brokers. Trade stocks, options, futures, forex, bonds and funds on 135 markets, all from a single integrated account. Promoted
New: Manage All Your Stock Portfolios in One Place
We've created the ultimate portfolio companion for stock investors, and it's free.
• Connect an unlimited number of Portfolios and see your total in one currency
• Be alerted to new Warning Signs or Risks via email or mobile
• Track the Fair Value of your stocks
This article by Simply Wall St is general in nature. It does not constitute a recommendation to buy or sell any stock, and does not take account of your objectives, or your financial situation. We aim to bring you long-term focused analysis driven by fundamental data. Note that our analysis may not factor in the latest price-sensitive company announcements or qualitative material. Simply Wall St has no position in any stocks mentioned.
*Interactive Brokers Rated Lowest Cost Broker by StockBrokers.com Annual Online Review 2020
Have feedback on this article? Concerned about the content? Get in touch with us directly. Alternatively, email editorial-team (at) simplywallst.com.
About NSEI:PGHH
Procter & Gamble Hygiene and Health Care
Engages in the manufacture and sale of branded packaged fast-moving consumer goods in the feminine care and healthcare businesses in India and internationally.
Excellent balance sheet with acceptable track record.
