- India
- /
- Consumer Finance
- /
- NSEI:SHRIRAMFIN
Investing in Shriram Finance (NSE:SHRIRAMFIN) three years ago would have delivered you a 221% gain


The worst result, after buying shares in a company (assuming no leverage), would be if you lose all the money you put in. But if you buy shares in a really great company, you can more than double your money. To wit, the Shriram Finance Limited (NSE:SHRIRAMFIN) share price has flown 204% in the last three years. That sort of return is as solid as granite. It's also good to see the share price up 35% over the last quarter.
With that in mind, it's worth seeing if the company's underlying fundamentals have been the driver of long term performance, or if there are some discrepancies.
View our latest analysis for Shriram Finance
To quote Buffett, 'Ships will sail around the world but the Flat Earth Society will flourish. There will continue to be wide discrepancies between price and value in the marketplace...' One way to examine how market sentiment has changed over time is to look at the interaction between a company's share price and its earnings per share (EPS).
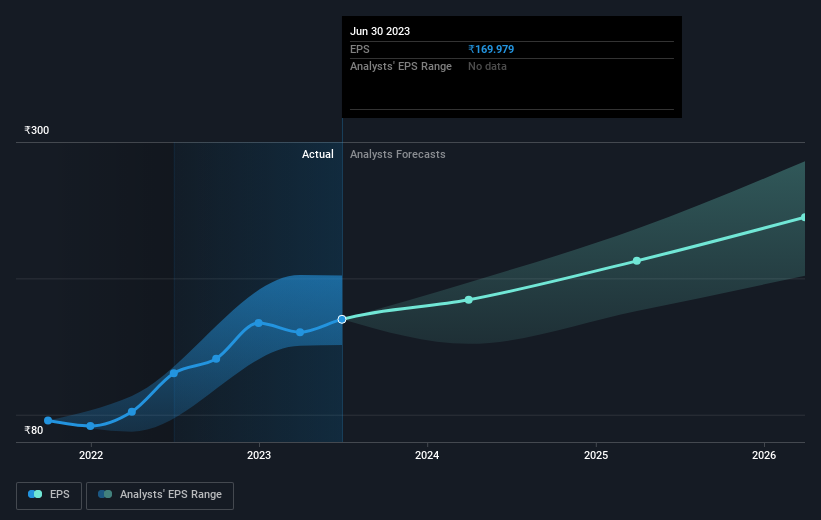
Shriram Finance was able to grow its EPS at 21% per year over three years, sending the share price higher. In comparison, the 45% per year gain in the share price outpaces the EPS growth. So it's fair to assume the market has a higher opinion of the business than it did three years ago. It is quite common to see investors become enamoured with a business, after a few years of solid progress.
You can see below how EPS has changed over time (discover the exact values by clicking on the image).
We're pleased to report that the CEO is remunerated more modestly than most CEOs at similarly capitalized companies. It's always worth keeping an eye on CEO pay, but a more important question is whether the company will grow earnings throughout the years. It might be well worthwhile taking a look at our free report on Shriram Finance's earnings, revenue and cash flow.
What About Dividends?
As well as measuring the share price return, investors should also consider the total shareholder return (TSR). The TSR is a return calculation that accounts for the value of cash dividends (assuming that any dividend received was reinvested) and the calculated value of any discounted capital raisings and spin-offs. It's fair to say that the TSR gives a more complete picture for stocks that pay a dividend. As it happens, Shriram Finance's TSR for the last 3 years was 221%, which exceeds the share price return mentioned earlier. The dividends paid by the company have thusly boosted the total shareholder return.
A Different Perspective
It's good to see that Shriram Finance has rewarded shareholders with a total shareholder return of 51% in the last twelve months. Of course, that includes the dividend. That's better than the annualised return of 12% over half a decade, implying that the company is doing better recently. Someone with an optimistic perspective could view the recent improvement in TSR as indicating that the business itself is getting better with time. It's always interesting to track share price performance over the longer term. But to understand Shriram Finance better, we need to consider many other factors. Even so, be aware that Shriram Finance is showing 3 warning signs in our investment analysis , and 1 of those makes us a bit uncomfortable...
For those who like to find winning investments this free list of growing companies with recent insider purchasing, could be just the ticket.
Please note, the market returns quoted in this article reflect the market weighted average returns of stocks that currently trade on Indian exchanges.
New: Manage All Your Stock Portfolios in One Place
We've created the ultimate portfolio companion for stock investors, and it's free.
• Connect an unlimited number of Portfolios and see your total in one currency
• Be alerted to new Warning Signs or Risks via email or mobile
• Track the Fair Value of your stocks
Have feedback on this article? Concerned about the content? Get in touch with us directly. Alternatively, email editorial-team (at) simplywallst.com.
This article by Simply Wall St is general in nature. We provide commentary based on historical data and analyst forecasts only using an unbiased methodology and our articles are not intended to be financial advice. It does not constitute a recommendation to buy or sell any stock, and does not take account of your objectives, or your financial situation. We aim to bring you long-term focused analysis driven by fundamental data. Note that our analysis may not factor in the latest price-sensitive company announcements or qualitative material. Simply Wall St has no position in any stocks mentioned.
About NSEI:SHRIRAMFIN
Shriram Finance
A non-banking finance company, primarily engages in the provision of financing services in India.
Average dividend payer and fair value.
