Stock Analysis
- India
- /
- Consumer Finance
- /
- NSEI:CGCL
Capri Global Capital (NSE:CGCL) sheds 5.0% this week, as yearly returns fall more in line with earnings growth


We think all investors should try to buy and hold high quality multi-year winners. While not every stock performs well, when investors win, they can win big. Don't believe it? Then look at the Capri Global Capital Limited (NSE:CGCL) share price. It's 448% higher than it was five years ago. If that doesn't get you thinking about long term investing, we don't know what will. In more good news, the share price has risen 12% in thirty days.
While the stock has fallen 5.0% this week, it's worth focusing on the longer term and seeing if the stocks historical returns have been driven by the underlying fundamentals.
See our latest analysis for Capri Global Capital
To paraphrase Benjamin Graham: Over the short term the market is a voting machine, but over the long term it's a weighing machine. One flawed but reasonable way to assess how sentiment around a company has changed is to compare the earnings per share (EPS) with the share price.
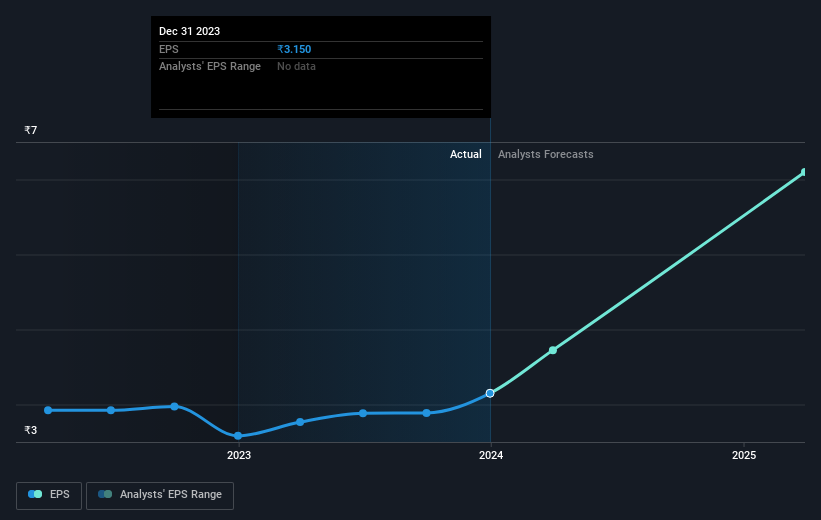
Over half a decade, Capri Global Capital managed to grow its earnings per share at 10% a year. This EPS growth is lower than the 41% average annual increase in the share price. So it's fair to assume the market has a higher opinion of the business than it did five years ago. That's not necessarily surprising considering the five-year track record of earnings growth. This optimism is visible in its fairly high P/E ratio of 71.73.
You can see how EPS has changed over time in the image below (click on the chart to see the exact values).
We're pleased to report that the CEO is remunerated more modestly than most CEOs at similarly capitalized companies. It's always worth keeping an eye on CEO pay, but a more important question is whether the company will grow earnings throughout the years. Before buying or selling a stock, we always recommend a close examination of historic growth trends, available here..
What About Dividends?
It is important to consider the total shareholder return, as well as the share price return, for any given stock. Whereas the share price return only reflects the change in the share price, the TSR includes the value of dividends (assuming they were reinvested) and the benefit of any discounted capital raising or spin-off. So for companies that pay a generous dividend, the TSR is often a lot higher than the share price return. We note that for Capri Global Capital the TSR over the last 5 years was 483%, which is better than the share price return mentioned above. And there's no prize for guessing that the dividend payments largely explain the divergence!
A Different Perspective
Capri Global Capital provided a TSR of 41% over the last twelve months. But that was short of the market average. On the bright side, the longer term returns (running at about 42% a year, over half a decade) look better. Maybe the share price is just taking a breather while the business executes on its growth strategy. It's always interesting to track share price performance over the longer term. But to understand Capri Global Capital better, we need to consider many other factors. Even so, be aware that Capri Global Capital is showing 2 warning signs in our investment analysis , you should know about...
Of course Capri Global Capital may not be the best stock to buy. So you may wish to see this free collection of growth stocks.
Please note, the market returns quoted in this article reflect the market weighted average returns of stocks that currently trade on Indian exchanges.
Valuation is complex, but we're helping make it simple.
Find out whether Capri Global Capital is potentially over or undervalued by checking out our comprehensive analysis, which includes fair value estimates, risks and warnings, dividends, insider transactions and financial health.
View the Free AnalysisHave feedback on this article? Concerned about the content? Get in touch with us directly. Alternatively, email editorial-team (at) simplywallst.com.
This article by Simply Wall St is general in nature. We provide commentary based on historical data and analyst forecasts only using an unbiased methodology and our articles are not intended to be financial advice. It does not constitute a recommendation to buy or sell any stock, and does not take account of your objectives, or your financial situation. We aim to bring you long-term focused analysis driven by fundamental data. Note that our analysis may not factor in the latest price-sensitive company announcements or qualitative material. Simply Wall St has no position in any stocks mentioned.
About NSEI:CGCL
Capri Global Capital
Capri Global Capital Limited, a non-banking financial company, provides financial services in India.
Moderate growth potential with acceptable track record.
