Stock Analysis
- India
- /
- Food and Staples Retail
- /
- NSEI:SAKUMA
Sakuma Exports' (NSE:SAKUMA) 80% CAGR outpaced the company's earnings growth over the same three-year period


Investing can be hard but the potential fo an individual stock to pay off big time inspires us. But when you hold the right stock for the right time period, the rewards can be truly huge. Take, for example, the Sakuma Exports Limited (NSE:SAKUMA) share price, which skyrocketed 476% over three years. On top of that, the share price is up 31% in about a quarter.
On the back of a solid 7-day performance, let's check what role the company's fundamentals have played in driving long term shareholder returns.
See our latest analysis for Sakuma Exports
There is no denying that markets are sometimes efficient, but prices do not always reflect underlying business performance. By comparing earnings per share (EPS) and share price changes over time, we can get a feel for how investor attitudes to a company have morphed over time.
During three years of share price growth, Sakuma Exports achieved compound earnings per share growth of 26% per year. In comparison, the 79% per year gain in the share price outpaces the EPS growth. This suggests that, as the business progressed over the last few years, it gained the confidence of market participants. That's not necessarily surprising considering the three-year track record of earnings growth.
The company's earnings per share (over time) is depicted in the image below (click to see the exact numbers).
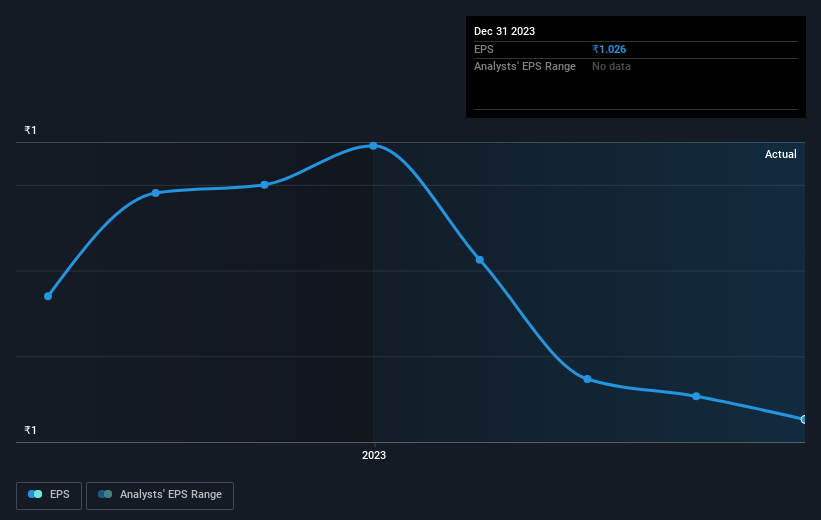
Dive deeper into Sakuma Exports' key metrics by checking this interactive graph of Sakuma Exports's earnings, revenue and cash flow.
What About Dividends?
When looking at investment returns, it is important to consider the difference between total shareholder return (TSR) and share price return. The TSR is a return calculation that accounts for the value of cash dividends (assuming that any dividend received was reinvested) and the calculated value of any discounted capital raisings and spin-offs. It's fair to say that the TSR gives a more complete picture for stocks that pay a dividend. As it happens, Sakuma Exports' TSR for the last 3 years was 484%, which exceeds the share price return mentioned earlier. The dividends paid by the company have thusly boosted the total shareholder return.
A Different Perspective
It's nice to see that Sakuma Exports shareholders have received a total shareholder return of 132% over the last year. And that does include the dividend. There's no doubt those recent returns are much better than the TSR loss of 1.2% per year over five years. The long term loss makes us cautious, but the short term TSR gain certainly hints at a brighter future. While it is well worth considering the different impacts that market conditions can have on the share price, there are other factors that are even more important. For instance, we've identified 3 warning signs for Sakuma Exports (1 is potentially serious) that you should be aware of.
We will like Sakuma Exports better if we see some big insider buys. While we wait, check out this free list of growing companies with considerable, recent, insider buying.
Please note, the market returns quoted in this article reflect the market weighted average returns of stocks that currently trade on Indian exchanges.
Valuation is complex, but we're helping make it simple.
Find out whether Sakuma Exports is potentially over or undervalued by checking out our comprehensive analysis, which includes fair value estimates, risks and warnings, dividends, insider transactions and financial health.
View the Free AnalysisHave feedback on this article? Concerned about the content? Get in touch with us directly. Alternatively, email editorial-team (at) simplywallst.com.
This article by Simply Wall St is general in nature. We provide commentary based on historical data and analyst forecasts only using an unbiased methodology and our articles are not intended to be financial advice. It does not constitute a recommendation to buy or sell any stock, and does not take account of your objectives, or your financial situation. We aim to bring you long-term focused analysis driven by fundamental data. Note that our analysis may not factor in the latest price-sensitive company announcements or qualitative material. Simply Wall St has no position in any stocks mentioned.
About NSEI:SAKUMA
Sakuma Exports
Sakuma Exports Limited engages in the trading of agro commodities and caters in India.
Excellent balance sheet and slightly overvalued.
