- India
- /
- Trade Distributors
- /
- NSEI:SIDDHIKA
Could The Market Be Wrong About Siddhika Coatings Limited (NSE:SIDDHIKA) Given Its Attractive Financial Prospects?


With its stock down 23% over the past three months, it is easy to disregard Siddhika Coatings (NSE:SIDDHIKA). However, a closer look at its sound financials might cause you to think again. Given that fundamentals usually drive long-term market outcomes, the company is worth looking at. Particularly, we will be paying attention to Siddhika Coatings' ROE today.
Return on equity or ROE is an important factor to be considered by a shareholder because it tells them how effectively their capital is being reinvested. In other words, it is a profitability ratio which measures the rate of return on the capital provided by the company's shareholders.
See our latest analysis for Siddhika Coatings
How Do You Calculate Return On Equity?
The formula for return on equity is:
Return on Equity = Net Profit (from continuing operations) ÷ Shareholders' Equity
So, based on the above formula, the ROE for Siddhika Coatings is:
16% = ₹50m ÷ ₹311m (Based on the trailing twelve months to March 2024).
The 'return' is the profit over the last twelve months. So, this means that for every ₹1 of its shareholder's investments, the company generates a profit of ₹0.16.
Why Is ROE Important For Earnings Growth?
We have already established that ROE serves as an efficient profit-generating gauge for a company's future earnings. Depending on how much of these profits the company reinvests or "retains", and how effectively it does so, we are then able to assess a company’s earnings growth potential. Assuming everything else remains unchanged, the higher the ROE and profit retention, the higher the growth rate of a company compared to companies that don't necessarily bear these characteristics.
Siddhika Coatings' Earnings Growth And 16% ROE
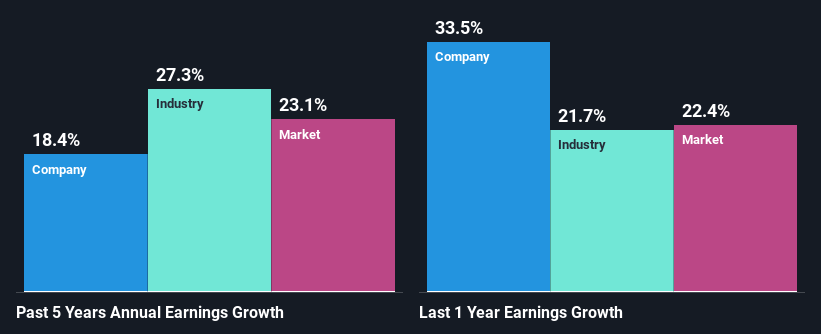
At first glance, Siddhika Coatings seems to have a decent ROE. Especially when compared to the industry average of 7.1% the company's ROE looks pretty impressive. Probably as a result of this, Siddhika Coatings was able to see a decent growth of 18% over the last five years.
Next, on comparing with the industry net income growth, we found that Siddhika Coatings' reported growth was lower than the industry growth of 27% over the last few years, which is not something we like to see.
Earnings growth is an important metric to consider when valuing a stock. What investors need to determine next is if the expected earnings growth, or the lack of it, is already built into the share price. This then helps them determine if the stock is placed for a bright or bleak future. Is Siddhika Coatings fairly valued compared to other companies? These 3 valuation measures might help you decide.
Is Siddhika Coatings Efficiently Re-investing Its Profits?
Siddhika Coatings has a three-year median payout ratio of 38%, which implies that it retains the remaining 62% of its profits. This suggests that its dividend is well covered, and given the decent growth seen by the company, it looks like management is reinvesting its earnings efficiently.
Moreover, Siddhika Coatings is determined to keep sharing its profits with shareholders which we infer from its long history of three years of paying a dividend.
Summary
In total, we are pretty happy with Siddhika Coatings' performance. Particularly, we like that the company is reinvesting heavily into its business, and at a high rate of return. As a result, the decent growth in its earnings is not surprising. If the company continues to grow its earnings the way it has, that could have a positive impact on its share price given how earnings per share influence long-term share prices. Let's not forget, business risk is also one of the factors that affects the price of the stock. So this is also an important area that investors need to pay attention to before making a decision on any business. You can see the 4 risks we have identified for Siddhika Coatings by visiting our risks dashboard for free on our platform here.
New: Manage All Your Stock Portfolios in One Place
We've created the ultimate portfolio companion for stock investors, and it's free.
• Connect an unlimited number of Portfolios and see your total in one currency
• Be alerted to new Warning Signs or Risks via email or mobile
• Track the Fair Value of your stocks
Have feedback on this article? Concerned about the content? Get in touch with us directly. Alternatively, email editorial-team (at) simplywallst.com.
This article by Simply Wall St is general in nature. We provide commentary based on historical data and analyst forecasts only using an unbiased methodology and our articles are not intended to be financial advice. It does not constitute a recommendation to buy or sell any stock, and does not take account of your objectives, or your financial situation. We aim to bring you long-term focused analysis driven by fundamental data. Note that our analysis may not factor in the latest price-sensitive company announcements or qualitative material. Simply Wall St has no position in any stocks mentioned.
About NSEI:SIDDHIKA
Siddhika Coatings
A texture paint contract company, engages in marketing coatings and pigments in India.
Flawless balance sheet with solid track record and pays a dividend.
