Stock Analysis

Shanthi Gears (NSE:SHANTIGEAR) has had a great run on the share market with its stock up by a significant 14% over the last week. Given the company's impressive performance, we decided to study its financial indicators more closely as a company's financial health over the long-term usually dictates market outcomes. In this article, we decided to focus on Shanthi Gears' ROE.
Return on equity or ROE is a key measure used to assess how efficiently a company's management is utilizing the company's capital. In other words, it is a profitability ratio which measures the rate of return on the capital provided by the company's shareholders.
View our latest analysis for Shanthi Gears
How Is ROE Calculated?
ROE can be calculated by using the formula:
Return on Equity = Net Profit (from continuing operations) ÷ Shareholders' Equity
So, based on the above formula, the ROE for Shanthi Gears is:
23% = ₹760m ÷ ₹3.3b (Based on the trailing twelve months to December 2023).
The 'return' refers to a company's earnings over the last year. Another way to think of that is that for every ₹1 worth of equity, the company was able to earn ₹0.23 in profit.
Why Is ROE Important For Earnings Growth?
So far, we've learned that ROE is a measure of a company's profitability. Depending on how much of these profits the company reinvests or "retains", and how effectively it does so, we are then able to assess a company’s earnings growth potential. Assuming all else is equal, companies that have both a higher return on equity and higher profit retention are usually the ones that have a higher growth rate when compared to companies that don't have the same features.
Shanthi Gears' Earnings Growth And 23% ROE
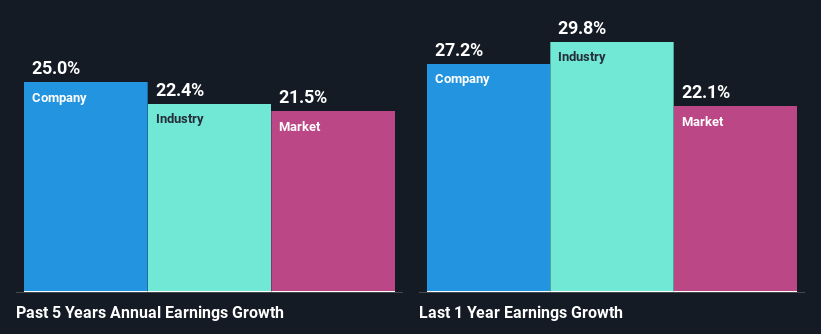
To start with, Shanthi Gears' ROE looks acceptable. Further, the company's ROE compares quite favorably to the industry average of 16%. Probably as a result of this, Shanthi Gears was able to see an impressive net income growth of 25% over the last five years. We reckon that there could also be other factors at play here. For instance, the company has a low payout ratio or is being managed efficiently.
Next, on comparing Shanthi Gears' net income growth with the industry, we found that the company's reported growth is similar to the industry average growth rate of 22% over the last few years.
The basis for attaching value to a company is, to a great extent, tied to its earnings growth. It’s important for an investor to know whether the market has priced in the company's expected earnings growth (or decline). By doing so, they will have an idea if the stock is headed into clear blue waters or if swampy waters await. If you're wondering about Shanthi Gears''s valuation, check out this gauge of its price-to-earnings ratio, as compared to its industry.
Is Shanthi Gears Making Efficient Use Of Its Profits?
The three-year median payout ratio for Shanthi Gears is 48%, which is moderately low. The company is retaining the remaining 52%. By the looks of it, the dividend is well covered and Shanthi Gears is reinvesting its profits efficiently as evidenced by its exceptional growth which we discussed above.
Besides, Shanthi Gears has been paying dividends for at least ten years or more. This shows that the company is committed to sharing profits with its shareholders.
Summary
On the whole, we feel that Shanthi Gears' performance has been quite good. In particular, it's great to see that the company is investing heavily into its business and along with a high rate of return, that has resulted in a sizeable growth in its earnings. That being so, a study of the latest analyst forecasts show that the company is expected to see a slowdown in its future earnings growth. Are these analysts expectations based on the broad expectations for the industry, or on the company's fundamentals? Click here to be taken to our analyst's forecasts page for the company.
Valuation is complex, but we're helping make it simple.
Find out whether Shanthi Gears is potentially over or undervalued by checking out our comprehensive analysis, which includes fair value estimates, risks and warnings, dividends, insider transactions and financial health.
View the Free AnalysisHave feedback on this article? Concerned about the content? Get in touch with us directly. Alternatively, email editorial-team (at) simplywallst.com.
This article by Simply Wall St is general in nature. We provide commentary based on historical data and analyst forecasts only using an unbiased methodology and our articles are not intended to be financial advice. It does not constitute a recommendation to buy or sell any stock, and does not take account of your objectives, or your financial situation. We aim to bring you long-term focused analysis driven by fundamental data. Note that our analysis may not factor in the latest price-sensitive company announcements or qualitative material. Simply Wall St has no position in any stocks mentioned.
About NSEI:SHANTIGEAR
Shanthi Gears
Shanthi Gears Limited designs, manufactures, supplies, and services gears and gear boxes in India, the United States, Europe, and internationally.
Flawless balance sheet with solid track record and pays a dividend.

