- India
- /
- Construction
- /
- NSEI:SALASAR
Here's What To Make Of Salasar Techno Engineering's (NSE:SALASAR) Returns On Capital


There are a few key trends to look for if we want to identify the next multi-bagger. Amongst other things, we'll want to see two things; firstly, a growing return on capital employed (ROCE) and secondly, an expansion in the company's amount of capital employed. Put simply, these types of businesses are compounding machines, meaning they are continually reinvesting their earnings at ever-higher rates of return. However, after briefly looking over the numbers, we don't think Salasar Techno Engineering (NSE:SALASAR) has the makings of a multi-bagger going forward, but let's have a look at why that may be.
Understanding Return On Capital Employed (ROCE)
For those that aren't sure what ROCE is, it measures the amount of pre-tax profits a company can generate from the capital employed in its business. Analysts use this formula to calculate it for Salasar Techno Engineering:
Return on Capital Employed = Earnings Before Interest and Tax (EBIT) ÷ (Total Assets - Current Liabilities)
0.19 = ₹425m ÷ (₹4.7b - ₹2.4b) (Based on the trailing twelve months to December 2020).
Therefore, Salasar Techno Engineering has an ROCE of 19%. On its own, that's a standard return, however it's much better than the 9.9% generated by the Construction industry.
View our latest analysis for Salasar Techno Engineering
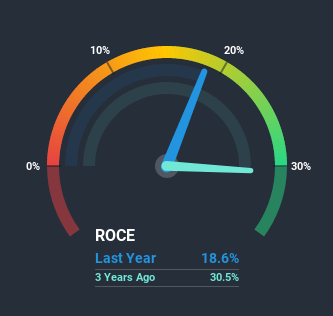
Historical performance is a great place to start when researching a stock so above you can see the gauge for Salasar Techno Engineering's ROCE against it's prior returns. If you'd like to look at how Salasar Techno Engineering has performed in the past in other metrics, you can view this free graph of past earnings, revenue and cash flow.
What Can We Tell From Salasar Techno Engineering's ROCE Trend?
On the surface, the trend of ROCE at Salasar Techno Engineering doesn't inspire confidence. To be more specific, ROCE has fallen from 29% over the last five years. Given the business is employing more capital while revenue has slipped, this is a bit concerning. If this were to continue, you might be looking at a company that is trying to reinvest for growth but is actually losing market share since sales haven't increased.
Another thing to note, Salasar Techno Engineering has a high ratio of current liabilities to total assets of 51%. This effectively means that suppliers (or short-term creditors) are funding a large portion of the business, so just be aware that this can introduce some elements of risk. While it's not necessarily a bad thing, it can be beneficial if this ratio is lower.
In Conclusion...
We're a bit apprehensive about Salasar Techno Engineering because despite more capital being deployed in the business, returns on that capital and sales have both fallen. In spite of that, the stock has delivered a 13% return to shareholders who held over the last three years. Regardless, we don't like the trends as they are and if they persist, we think you might find better investments elsewhere.
If you want to continue researching Salasar Techno Engineering, you might be interested to know about the 4 warning signs that our analysis has discovered.
For those who like to invest in solid companies, check out this free list of companies with solid balance sheets and high returns on equity.
If you’re looking to trade Salasar Techno Engineering, open an account with the lowest-cost* platform trusted by professionals, Interactive Brokers. Their clients from over 200 countries and territories trade stocks, options, futures, forex, bonds and funds worldwide from a single integrated account. Promoted
New: Manage All Your Stock Portfolios in One Place
We've created the ultimate portfolio companion for stock investors, and it's free.
• Connect an unlimited number of Portfolios and see your total in one currency
• Be alerted to new Warning Signs or Risks via email or mobile
• Track the Fair Value of your stocks
This article by Simply Wall St is general in nature. It does not constitute a recommendation to buy or sell any stock, and does not take account of your objectives, or your financial situation. We aim to bring you long-term focused analysis driven by fundamental data. Note that our analysis may not factor in the latest price-sensitive company announcements or qualitative material. Simply Wall St has no position in any stocks mentioned.
*Interactive Brokers Rated Lowest Cost Broker by StockBrokers.com Annual Online Review 2020
Have feedback on this article? Concerned about the content? Get in touch with us directly. Alternatively, email editorial-team (at) simplywallst.com.
About NSEI:SALASAR
Salasar Techno Engineering
Engages in the manufacture and sale of galvanized and non-galvanized steel structures in India and internationally.
Proven track record with adequate balance sheet.

