Stock Analysis
- India
- /
- Construction
- /
- NSEI:MANINDS
Man Industries (India) (NSE:MANINDS) jumps 16% this week, though earnings growth is still tracking behind five-year shareholder returns


Buying shares in the best businesses can build meaningful wealth for you and your family. While not every stock performs well, when investors win, they can win big. To wit, the Man Industries (India) Limited (NSE:MANINDS) share price has soared 506% over five years. And this is just one example of the epic gains achieved by some long term investors. Better yet, the share price has risen 16% in the last week. We love happy stories like this one. The company should be really proud of that performance!
The past week has proven to be lucrative for Man Industries (India) investors, so let's see if fundamentals drove the company's five-year performance.
See our latest analysis for Man Industries (India)
To quote Buffett, 'Ships will sail around the world but the Flat Earth Society will flourish. There will continue to be wide discrepancies between price and value in the marketplace...' One flawed but reasonable way to assess how sentiment around a company has changed is to compare the earnings per share (EPS) with the share price.
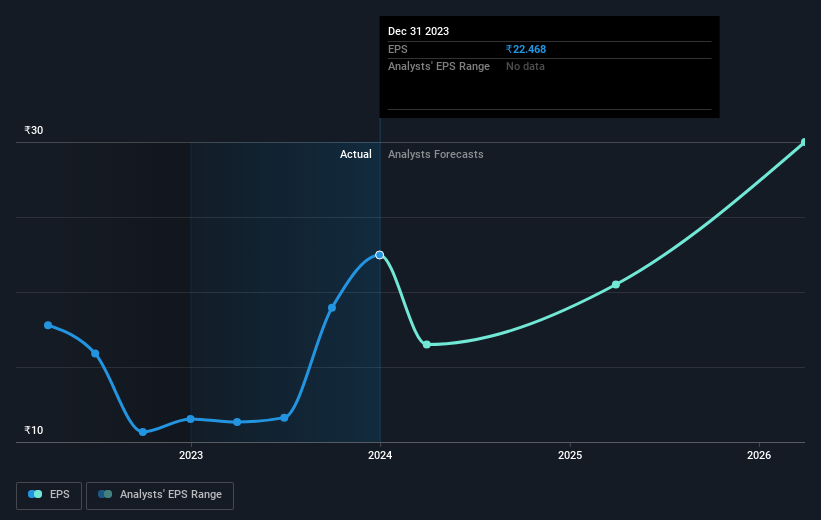
During five years of share price growth, Man Industries (India) achieved compound earnings per share (EPS) growth of 9.9% per year. This EPS growth is slower than the share price growth of 43% per year, over the same period. So it's fair to assume the market has a higher opinion of the business than it did five years ago. And that's hardly shocking given the track record of growth.
You can see how EPS has changed over time in the image below (click on the chart to see the exact values).
We know that Man Industries (India) has improved its bottom line lately, but is it going to grow revenue? This free report showing analyst revenue forecasts should help you figure out if the EPS growth can be sustained.
What About Dividends?
As well as measuring the share price return, investors should also consider the total shareholder return (TSR). Whereas the share price return only reflects the change in the share price, the TSR includes the value of dividends (assuming they were reinvested) and the benefit of any discounted capital raising or spin-off. It's fair to say that the TSR gives a more complete picture for stocks that pay a dividend. We note that for Man Industries (India) the TSR over the last 5 years was 584%, which is better than the share price return mentioned above. And there's no prize for guessing that the dividend payments largely explain the divergence!
A Different Perspective
It's good to see that Man Industries (India) has rewarded shareholders with a total shareholder return of 358% in the last twelve months. And that does include the dividend. That's better than the annualised return of 47% over half a decade, implying that the company is doing better recently. Given the share price momentum remains strong, it might be worth taking a closer look at the stock, lest you miss an opportunity. I find it very interesting to look at share price over the long term as a proxy for business performance. But to truly gain insight, we need to consider other information, too. For example, we've discovered 2 warning signs for Man Industries (India) that you should be aware of before investing here.
We will like Man Industries (India) better if we see some big insider buys. While we wait, check out this free list of growing companies with considerable, recent, insider buying.
Please note, the market returns quoted in this article reflect the market weighted average returns of stocks that currently trade on Indian exchanges.
Valuation is complex, but we're helping make it simple.
Find out whether Man Industries (India) is potentially over or undervalued by checking out our comprehensive analysis, which includes fair value estimates, risks and warnings, dividends, insider transactions and financial health.
View the Free AnalysisHave feedback on this article? Concerned about the content? Get in touch with us directly. Alternatively, email editorial-team (at) simplywallst.com.
This article by Simply Wall St is general in nature. We provide commentary based on historical data and analyst forecasts only using an unbiased methodology and our articles are not intended to be financial advice. It does not constitute a recommendation to buy or sell any stock, and does not take account of your objectives, or your financial situation. We aim to bring you long-term focused analysis driven by fundamental data. Note that our analysis may not factor in the latest price-sensitive company announcements or qualitative material. Simply Wall St has no position in any stocks mentioned.
About NSEI:MANINDS
Man Industries (India)
Man Industries (India) Limited manufactures, processes, and trades in submerged arc welded pipes and steel products in India.
Flawless balance sheet with high growth potential.
