Stock Analysis

For many, the main point of investing in the stock market is to achieve spectacular returns. And highest quality companies can see their share prices grow by huge amounts. Don't believe it? Then look at the KSB Limited (NSE:KSB) share price. It's 459% higher than it was five years ago. And this is just one example of the epic gains achieved by some long term investors. We note the stock price is up 7.5% in the last seven days.
The past week has proven to be lucrative for KSB investors, so let's see if fundamentals drove the company's five-year performance.
See our latest analysis for KSB
To paraphrase Benjamin Graham: Over the short term the market is a voting machine, but over the long term it's a weighing machine. One imperfect but simple way to consider how the market perception of a company has shifted is to compare the change in the earnings per share (EPS) with the share price movement.
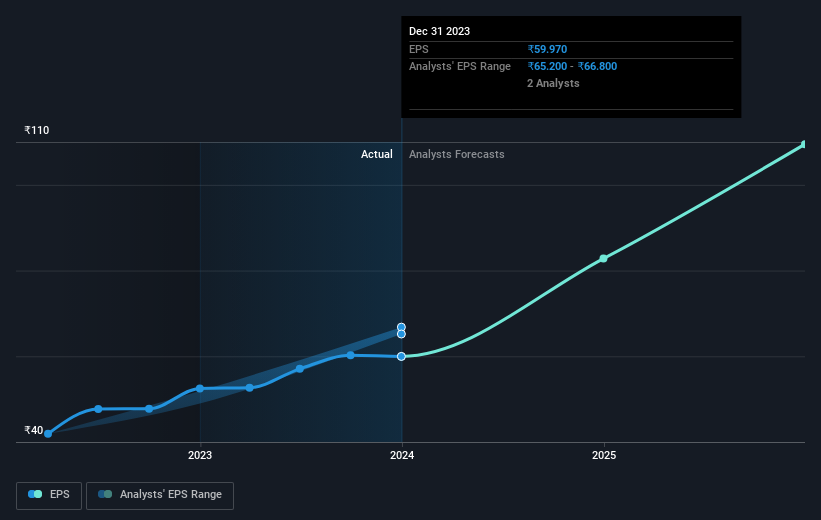
During five years of share price growth, KSB achieved compound earnings per share (EPS) growth of 24% per year. This EPS growth is slower than the share price growth of 41% per year, over the same period. This suggests that market participants hold the company in higher regard, these days. That's not necessarily surprising considering the five-year track record of earnings growth. This favorable sentiment is reflected in its (fairly optimistic) P/E ratio of 62.32.
The graphic below depicts how EPS has changed over time (unveil the exact values by clicking on the image).
It is of course excellent to see how KSB has grown profits over the years, but the future is more important for shareholders. Take a more thorough look at KSB's financial health with this free report on its balance sheet.
What About Dividends?
When looking at investment returns, it is important to consider the difference between total shareholder return (TSR) and share price return. The TSR is a return calculation that accounts for the value of cash dividends (assuming that any dividend received was reinvested) and the calculated value of any discounted capital raisings and spin-offs. Arguably, the TSR gives a more comprehensive picture of the return generated by a stock. As it happens, KSB's TSR for the last 5 years was 488%, which exceeds the share price return mentioned earlier. This is largely a result of its dividend payments!
A Different Perspective
It's good to see that KSB has rewarded shareholders with a total shareholder return of 81% in the last twelve months. Of course, that includes the dividend. That gain is better than the annual TSR over five years, which is 43%. Therefore it seems like sentiment around the company has been positive lately. Someone with an optimistic perspective could view the recent improvement in TSR as indicating that the business itself is getting better with time. It's always interesting to track share price performance over the longer term. But to understand KSB better, we need to consider many other factors. For instance, we've identified 1 warning sign for KSB that you should be aware of.
But note: KSB may not be the best stock to buy. So take a peek at this free list of interesting companies with past earnings growth (and further growth forecast).
Please note, the market returns quoted in this article reflect the market weighted average returns of stocks that currently trade on Indian exchanges.
Valuation is complex, but we're helping make it simple.
Find out whether KSB is potentially over or undervalued by checking out our comprehensive analysis, which includes fair value estimates, risks and warnings, dividends, insider transactions and financial health.
View the Free AnalysisHave feedback on this article? Concerned about the content? Get in touch with us directly. Alternatively, email editorial-team (at) simplywallst.com.
This article by Simply Wall St is general in nature. We provide commentary based on historical data and analyst forecasts only using an unbiased methodology and our articles are not intended to be financial advice. It does not constitute a recommendation to buy or sell any stock, and does not take account of your objectives, or your financial situation. We aim to bring you long-term focused analysis driven by fundamental data. Note that our analysis may not factor in the latest price-sensitive company announcements or qualitative material. Simply Wall St has no position in any stocks mentioned.
About NSEI:KSB
KSB
KSB Limited engages in the manufacture and sale of power driven pumps and industrial valves in India and internationally.
Flawless balance sheet with reasonable growth potential and pays a dividend.

