- India
- /
- Electrical
- /
- NSEI:HBLPOWER
Introducing HBL Power Systems (NSE:HBLPOWER), The Stock That Zoomed 114% In The Last Year


Unfortunately, investing is risky - companies can and do go bankrupt. On the other hand, if you find a high quality business to buy (at the right price) you can more than double your money! For example, the HBL Power Systems Limited (NSE:HBLPOWER) share price has soared 114% return in just a single year. Better yet, the share price has gained 133% in the last quarter. In contrast, the longer term returns are negative, since the share price is 45% lower than it was three years ago.
See our latest analysis for HBL Power Systems
While markets are a powerful pricing mechanism, share prices reflect investor sentiment, not just underlying business performance. By comparing earnings per share (EPS) and share price changes over time, we can get a feel for how investor attitudes to a company have morphed over time.
Over the last twelve months, HBL Power Systems actually shrank its EPS by 63%.
Given the share price gain, we doubt the market is measuring progress with EPS. Therefore, it seems likely that investors are putting more weight on metrics other than EPS, at the moment.
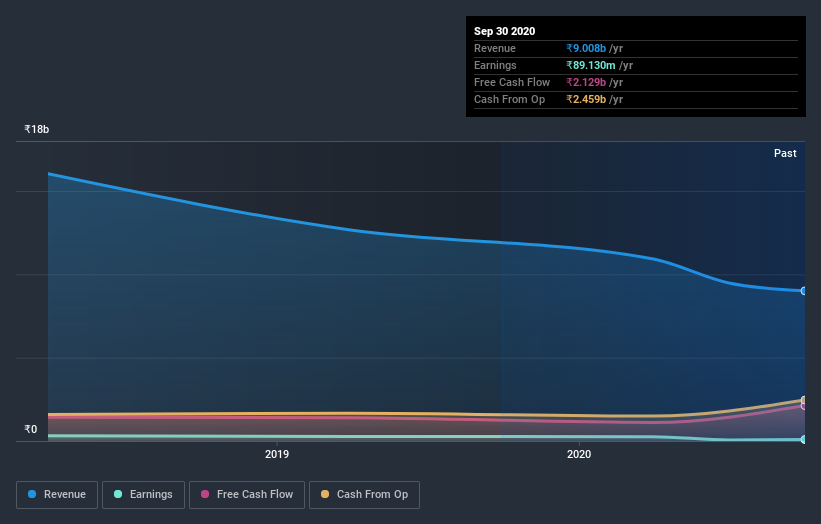
We doubt the modest 0.8% dividend yield is doing much to support the share price. HBL Power Systems' revenue actually dropped 24% over last year. So using a snapshot of key business metrics doesn't give us a good picture of why the market is bidding up the stock.
The image below shows how earnings and revenue have tracked over time (if you click on the image you can see greater detail).
Balance sheet strength is crucial. It might be well worthwhile taking a look at our free report on how its financial position has changed over time.
What About Dividends?
When looking at investment returns, it is important to consider the difference between total shareholder return (TSR) and share price return. The TSR is a return calculation that accounts for the value of cash dividends (assuming that any dividend received was reinvested) and the calculated value of any discounted capital raisings and spin-offs. It's fair to say that the TSR gives a more complete picture for stocks that pay a dividend. As it happens, HBL Power Systems' TSR for the last year was 118%, which exceeds the share price return mentioned earlier. And there's no prize for guessing that the dividend payments largely explain the divergence!
A Different Perspective
We're pleased to report that HBL Power Systems shareholders have received a total shareholder return of 118% over one year. Of course, that includes the dividend. That's better than the annualised return of 1.5% over half a decade, implying that the company is doing better recently. Someone with an optimistic perspective could view the recent improvement in TSR as indicating that the business itself is getting better with time. It's always interesting to track share price performance over the longer term. But to understand HBL Power Systems better, we need to consider many other factors. Consider for instance, the ever-present spectre of investment risk. We've identified 4 warning signs with HBL Power Systems (at least 1 which shouldn't be ignored) , and understanding them should be part of your investment process.
For those who like to find winning investments this free list of growing companies with recent insider purchasing, could be just the ticket.
Please note, the market returns quoted in this article reflect the market weighted average returns of stocks that currently trade on IN exchanges.
When trading HBL Power Systems or any other investment, use the platform considered by many to be the Professional's Gateway to the Worlds Market, Interactive Brokers. You get the lowest-cost* trading on stocks, options, futures, forex, bonds and funds worldwide from a single integrated account. Promoted
Valuation is complex, but we're here to simplify it.
Discover if HBL Power Systems might be undervalued or overvalued with our detailed analysis, featuring fair value estimates, potential risks, dividends, insider trades, and its financial condition.
Access Free AnalysisThis article by Simply Wall St is general in nature. It does not constitute a recommendation to buy or sell any stock, and does not take account of your objectives, or your financial situation. We aim to bring you long-term focused analysis driven by fundamental data. Note that our analysis may not factor in the latest price-sensitive company announcements or qualitative material. Simply Wall St has no position in any stocks mentioned.
*Interactive Brokers Rated Lowest Cost Broker by StockBrokers.com Annual Online Review 2020
Have feedback on this article? Concerned about the content? Get in touch with us directly. Alternatively, email editorial-team (at) simplywallst.com.
About NSEI:HBLPOWER
HBL Power Systems
Manufactures and sells batteries, power electronics, and spun concrete products in India and internationally.
Outstanding track record with flawless balance sheet.
