- India
- /
- Construction
- /
- NSEI:DBL
Can Dilip Buildcon Limited's (NSE:DBL) ROE Continue To Surpass The Industry Average?


One of the best investments we can make is in our own knowledge and skill set. With that in mind, this article will work through how we can use Return On Equity (ROE) to better understand a business. To keep the lesson grounded in practicality, we'll use ROE to better understand Dilip Buildcon Limited (NSE:DBL).
Return on Equity or ROE is a test of how effectively a company is growing its value and managing investors’ money. Simply put, it is used to assess the profitability of a company in relation to its equity capital.
See our latest analysis for Dilip Buildcon
How To Calculate Return On Equity?
The formula for ROE is:
Return on Equity = Net Profit (from continuing operations) ÷ Shareholders' Equity
So, based on the above formula, the ROE for Dilip Buildcon is:
10% = ₹3.5b ÷ ₹33b (Based on the trailing twelve months to September 2020).
The 'return' is the income the business earned over the last year. Another way to think of that is that for every ₹1 worth of equity, the company was able to earn ₹0.10 in profit.
Does Dilip Buildcon Have A Good ROE?
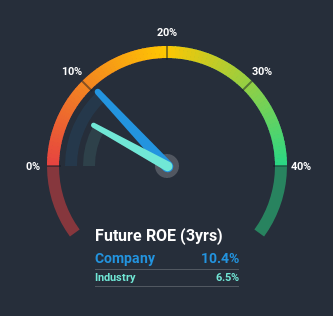
One simple way to determine if a company has a good return on equity is to compare it to the average for its industry. Importantly, this is far from a perfect measure, because companies differ significantly within the same industry classification. As you can see in the graphic below, Dilip Buildcon has a higher ROE than the average (6.5%) in the Construction industry.
That's what we like to see. Bear in mind, a high ROE doesn't always mean superior financial performance. A higher proportion of debt in a company's capital structure may also result in a high ROE, where the high debt levels could be a huge risk . Our risks dashboardshould have the 5 risks we have identified for Dilip Buildcon.
How Does Debt Impact ROE?
Most companies need money -- from somewhere -- to grow their profits. The cash for investment can come from prior year profits (retained earnings), issuing new shares, or borrowing. In the case of the first and second options, the ROE will reflect this use of cash, for growth. In the latter case, the use of debt will improve the returns, but will not change the equity. That will make the ROE look better than if no debt was used.
Combining Dilip Buildcon's Debt And Its 10% Return On Equity
Dilip Buildcon does use a high amount of debt to increase returns. It has a debt to equity ratio of 2.65. With a fairly low ROE, and significant use of debt, it's hard to get excited about this business at the moment. Debt does bring extra risk, so it's only really worthwhile when a company generates some decent returns from it.
Summary
Return on equity is one way we can compare its business quality of different companies. In our books, the highest quality companies have high return on equity, despite low debt. All else being equal, a higher ROE is better.
But when a business is high quality, the market often bids it up to a price that reflects this. Profit growth rates, versus the expectations reflected in the price of the stock, are a particularly important to consider. So I think it may be worth checking this free this detailed graph of past earnings, revenue and cash flow.
Of course Dilip Buildcon may not be the best stock to buy. So you may wish to see this free collection of other companies that have high ROE and low debt.
If you’re looking to trade Dilip Buildcon, open an account with the lowest-cost* platform trusted by professionals, Interactive Brokers. Their clients from over 200 countries and territories trade stocks, options, futures, forex, bonds and funds worldwide from a single integrated account. Promoted
New: Manage All Your Stock Portfolios in One Place
We've created the ultimate portfolio companion for stock investors, and it's free.
• Connect an unlimited number of Portfolios and see your total in one currency
• Be alerted to new Warning Signs or Risks via email or mobile
• Track the Fair Value of your stocks
This article by Simply Wall St is general in nature. It does not constitute a recommendation to buy or sell any stock, and does not take account of your objectives, or your financial situation. We aim to bring you long-term focused analysis driven by fundamental data. Note that our analysis may not factor in the latest price-sensitive company announcements or qualitative material. Simply Wall St has no position in any stocks mentioned.
*Interactive Brokers Rated Lowest Cost Broker by StockBrokers.com Annual Online Review 2020
Have feedback on this article? Concerned about the content? Get in touch with us directly. Alternatively, email editorial-team (at) simplywallst.com.
About NSEI:DBL
Dilip Buildcon
Together its subsidiaries, engages in the development of infrastructure facilities on engineering, procurement, and construction (EPC) basis in India.
Moderate growth potential with acceptable track record.
