The Astral Poly Technik (NSE:ASTRAL) Share Price Has Soared 651%, Delighting Many Shareholders


Long term investing can be life changing when you buy and hold the truly great businesses. While not every stock performs well, when investors win, they can win big. Don't believe it? Then look at the Astral Poly Technik Limited (NSE:ASTRAL) share price. It's 651% higher than it was five years ago. And this is just one example of the epic gains achieved by some long term investors. On top of that, the share price is up 50% in about a quarter.
Anyone who held for that rewarding ride would probably be keen to talk about it.
See our latest analysis for Astral Poly Technik
There is no denying that markets are sometimes efficient, but prices do not always reflect underlying business performance. One way to examine how market sentiment has changed over time is to look at the interaction between a company's share price and its earnings per share (EPS).
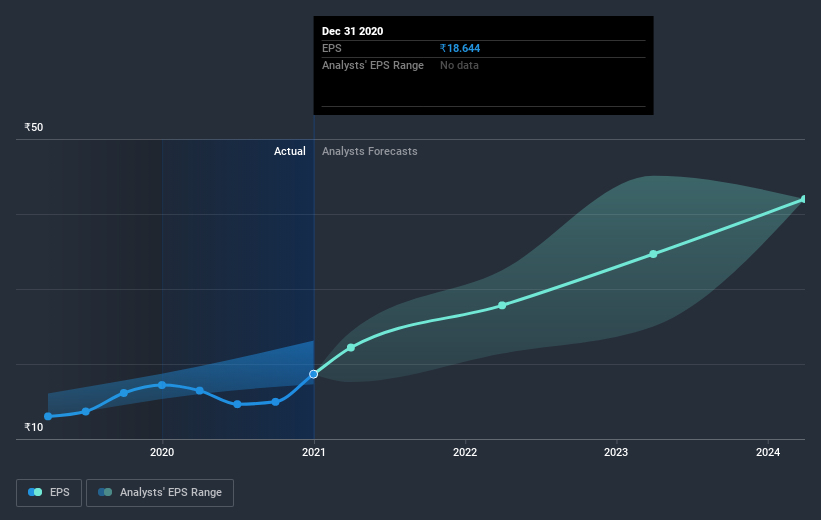
Over half a decade, Astral Poly Technik managed to grow its earnings per share at 28% a year. This EPS growth is lower than the 50% average annual increase in the share price. So it's fair to assume the market has a higher opinion of the business than it did five years ago. That's not necessarily surprising considering the five-year track record of earnings growth. This favorable sentiment is reflected in its (fairly optimistic) P/E ratio of 117.84.
The image below shows how EPS has tracked over time (if you click on the image you can see greater detail).
Dive deeper into Astral Poly Technik's key metrics by checking this interactive graph of Astral Poly Technik's earnings, revenue and cash flow.
What About Dividends?
When looking at investment returns, it is important to consider the difference between total shareholder return (TSR) and share price return. The TSR is a return calculation that accounts for the value of cash dividends (assuming that any dividend received was reinvested) and the calculated value of any discounted capital raisings and spin-offs. It's fair to say that the TSR gives a more complete picture for stocks that pay a dividend. In the case of Astral Poly Technik, it has a TSR of 654% for the last 5 years. That exceeds its share price return that we previously mentioned. This is largely a result of its dividend payments!
A Different Perspective
It's nice to see that Astral Poly Technik shareholders have received a total shareholder return of 91% over the last year. That's including the dividend. That gain is better than the annual TSR over five years, which is 50%. Therefore it seems like sentiment around the company has been positive lately. Given the share price momentum remains strong, it might be worth taking a closer look at the stock, lest you miss an opportunity. I find it very interesting to look at share price over the long term as a proxy for business performance. But to truly gain insight, we need to consider other information, too. For instance, we've identified 2 warning signs for Astral Poly Technik that you should be aware of.
For those who like to find winning investments this free list of growing companies with recent insider purchasing, could be just the ticket.
Please note, the market returns quoted in this article reflect the market weighted average returns of stocks that currently trade on IN exchanges.
When trading Astral Poly Technik or any other investment, use the platform considered by many to be the Professional's Gateway to the Worlds Market, Interactive Brokers. You get the lowest-cost* trading on stocks, options, futures, forex, bonds and funds worldwide from a single integrated account. Promoted
New: Manage All Your Stock Portfolios in One Place
We've created the ultimate portfolio companion for stock investors, and it's free.
• Connect an unlimited number of Portfolios and see your total in one currency
• Be alerted to new Warning Signs or Risks via email or mobile
• Track the Fair Value of your stocks
This article by Simply Wall St is general in nature. It does not constitute a recommendation to buy or sell any stock, and does not take account of your objectives, or your financial situation. We aim to bring you long-term focused analysis driven by fundamental data. Note that our analysis may not factor in the latest price-sensitive company announcements or qualitative material. Simply Wall St has no position in any stocks mentioned.
*Interactive Brokers Rated Lowest Cost Broker by StockBrokers.com Annual Online Review 2020
Have feedback on this article? Concerned about the content? Get in touch with us directly. Alternatively, email editorial-team (at) simplywallst.com.
About NSEI:ASTRAL
Astral
Engages in the manufacture and marketing of pipes, water tanks, and adhesives and sealants in India and internationally.
Flawless balance sheet with high growth potential and pays a dividend.

