- India
- /
- Construction
- /
- NSEI:AGNI
Is The Market Rewarding Agni Green Power Limited (NSE:AGNI) With A Negative Sentiment As A Result Of Its Mixed Fundamentals?


It is hard to get excited after looking at Agni Green Power's (NSE:AGNI) recent performance, when its stock has declined 34% over the past three months. It is possible that the markets have ignored the company's differing financials and decided to lean-in to the negative sentiment. Fundamentals usually dictate market outcomes so it makes sense to study the company's financials. Particularly, we will be paying attention to Agni Green Power's ROE today.
Return on Equity or ROE is a test of how effectively a company is growing its value and managing investors’ money. In simpler terms, it measures the profitability of a company in relation to shareholder's equity.
Check out our latest analysis for Agni Green Power
How Is ROE Calculated?
Return on equity can be calculated by using the formula:
Return on Equity = Net Profit (from continuing operations) ÷ Shareholders' Equity
So, based on the above formula, the ROE for Agni Green Power is:
1.2% = ₹3.8m ÷ ₹308m (Based on the trailing twelve months to March 2024).
The 'return' refers to a company's earnings over the last year. So, this means that for every ₹1 of its shareholder's investments, the company generates a profit of ₹0.01.
What Is The Relationship Between ROE And Earnings Growth?
So far, we've learned that ROE is a measure of a company's profitability. Based on how much of its profits the company chooses to reinvest or "retain", we are then able to evaluate a company's future ability to generate profits. Assuming everything else remains unchanged, the higher the ROE and profit retention, the higher the growth rate of a company compared to companies that don't necessarily bear these characteristics.
A Side By Side comparison of Agni Green Power's Earnings Growth And 1.2% ROE
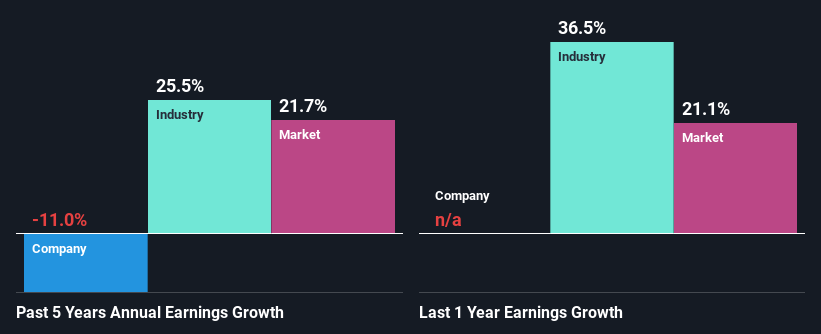
It is hard to argue that Agni Green Power's ROE is much good in and of itself. Even compared to the average industry ROE of 12%, the company's ROE is quite dismal. Given the circumstances, the significant decline in net income by 11% seen by Agni Green Power over the last five years is not surprising. We believe that there also might be other aspects that are negatively influencing the company's earnings prospects. For example, the business has allocated capital poorly, or that the company has a very high payout ratio.
However, when we compared Agni Green Power's growth with the industry we found that while the company's earnings have been shrinking, the industry has seen an earnings growth of 26% in the same period. This is quite worrisome.
Earnings growth is a huge factor in stock valuation. The investor should try to establish if the expected growth or decline in earnings, whichever the case may be, is priced in. Doing so will help them establish if the stock's future looks promising or ominous. If you're wondering about Agni Green Power's's valuation, check out this gauge of its price-to-earnings ratio, as compared to its industry.
Is Agni Green Power Making Efficient Use Of Its Profits?
Agni Green Power doesn't pay any regular dividends, meaning that potentially all of its profits are being reinvested in the business, which doesn't explain why the company's earnings have shrunk if it is retaining all of its profits. So there might be other factors at play here which could potentially be hampering growth. For example, the business has faced some headwinds.
Summary
Overall, we have mixed feelings about Agni Green Power. While the company does have a high rate of reinvestment, the low ROE means that all that reinvestment is not reaping any benefit to its investors, and moreover, its having a negative impact on the earnings growth. Wrapping up, we would proceed with caution with this company and one way of doing that would be to look at the risk profile of the business. To know the 3 risks we have identified for Agni Green Power visit our risks dashboard for free.
New: Manage All Your Stock Portfolios in One Place
We've created the ultimate portfolio companion for stock investors, and it's free.
• Connect an unlimited number of Portfolios and see your total in one currency
• Be alerted to new Warning Signs or Risks via email or mobile
• Track the Fair Value of your stocks
Have feedback on this article? Concerned about the content? Get in touch with us directly. Alternatively, email editorial-team (at) simplywallst.com.
This article by Simply Wall St is general in nature. We provide commentary based on historical data and analyst forecasts only using an unbiased methodology and our articles are not intended to be financial advice. It does not constitute a recommendation to buy or sell any stock, and does not take account of your objectives, or your financial situation. We aim to bring you long-term focused analysis driven by fundamental data. Note that our analysis may not factor in the latest price-sensitive company announcements or qualitative material. Simply Wall St has no position in any stocks mentioned.
Have feedback on this article? Concerned about the content? Get in touch with us directly. Alternatively, email editorial-team@simplywallst.com
About NSEI:AGNI
Agni Green Power
Agni Green Power Limited executes turn-key solar PV power plant projects in India.
Acceptable track record with mediocre balance sheet.
