- India
- /
- Auto Components
- /
- NSEI:MOTHERSON
These 4 Measures Indicate That Samvardhana Motherson International (NSE:MOTHERSON) Is Using Debt Extensively


Howard Marks put it nicely when he said that, rather than worrying about share price volatility, 'The possibility of permanent loss is the risk I worry about... and every practical investor I know worries about.' So it might be obvious that you need to consider debt, when you think about how risky any given stock is, because too much debt can sink a company. As with many other companies Samvardhana Motherson International Limited (NSE:MOTHERSON) makes use of debt. But the real question is whether this debt is making the company risky.
What Risk Does Debt Bring?
Debt and other liabilities become risky for a business when it cannot easily fulfill those obligations, either with free cash flow or by raising capital at an attractive price. If things get really bad, the lenders can take control of the business. However, a more common (but still painful) scenario is that it has to raise new equity capital at a low price, thus permanently diluting shareholders. By replacing dilution, though, debt can be an extremely good tool for businesses that need capital to invest in growth at high rates of return. When we think about a company's use of debt, we first look at cash and debt together.
View our latest analysis for Samvardhana Motherson International
What Is Samvardhana Motherson International's Debt?
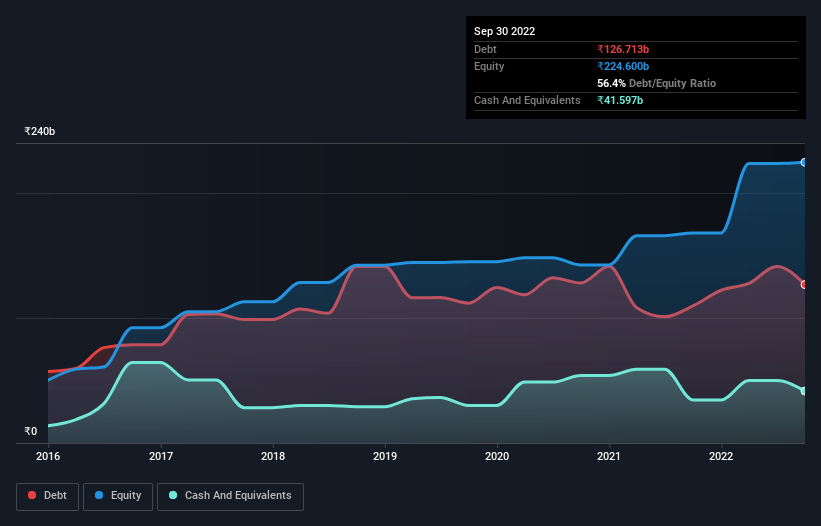
As you can see below, at the end of September 2022, Samvardhana Motherson International had ₹126.7b of debt, up from ₹109.6b a year ago. Click the image for more detail. On the flip side, it has ₹41.6b in cash leading to net debt of about ₹85.1b.
How Healthy Is Samvardhana Motherson International's Balance Sheet?
Zooming in on the latest balance sheet data, we can see that Samvardhana Motherson International had liabilities of ₹264.0b due within 12 months and liabilities of ₹83.5b due beyond that. Offsetting these obligations, it had cash of ₹41.6b as well as receivables valued at ₹74.0b due within 12 months. So its liabilities total ₹231.9b more than the combination of its cash and short-term receivables.
Samvardhana Motherson International has a market capitalization of ₹453.3b, so it could very likely raise cash to ameliorate its balance sheet, if the need arose. But it's clear that we should definitely closely examine whether it can manage its debt without dilution.
In order to size up a company's debt relative to its earnings, we calculate its net debt divided by its earnings before interest, tax, depreciation, and amortization (EBITDA) and its earnings before interest and tax (EBIT) divided by its interest expense (its interest cover). The advantage of this approach is that we take into account both the absolute quantum of debt (with net debt to EBITDA) and the actual interest expenses associated with that debt (with its interest cover ratio).
With a debt to EBITDA ratio of 1.9, Samvardhana Motherson International uses debt artfully but responsibly. And the alluring interest cover (EBIT of 7.2 times interest expense) certainly does not do anything to dispel this impression. Importantly, Samvardhana Motherson International's EBIT fell a jaw-dropping 34% in the last twelve months. If that earnings trend continues then paying off its debt will be about as easy as herding cats on to a roller coaster. The balance sheet is clearly the area to focus on when you are analysing debt. But ultimately the future profitability of the business will decide if Samvardhana Motherson International can strengthen its balance sheet over time. So if you want to see what the professionals think, you might find this free report on analyst profit forecasts to be interesting.
Finally, while the tax-man may adore accounting profits, lenders only accept cold hard cash. So we clearly need to look at whether that EBIT is leading to corresponding free cash flow. Happily for any shareholders, Samvardhana Motherson International actually produced more free cash flow than EBIT over the last three years. That sort of strong cash conversion gets us as excited as the crowd when the beat drops at a Daft Punk concert.
Our View
Samvardhana Motherson International's EBIT growth rate and level of total liabilities definitely weigh on it, in our esteem. But its conversion of EBIT to free cash flow tells a very different story, and suggests some resilience. We think that Samvardhana Motherson International's debt does make it a bit risky, after considering the aforementioned data points together. Not all risk is bad, as it can boost share price returns if it pays off, but this debt risk is worth keeping in mind. There's no doubt that we learn most about debt from the balance sheet. But ultimately, every company can contain risks that exist outside of the balance sheet. Case in point: We've spotted 3 warning signs for Samvardhana Motherson International you should be aware of.
If you're interested in investing in businesses that can grow profits without the burden of debt, then check out this free list of growing businesses that have net cash on the balance sheet.
New: Manage All Your Stock Portfolios in One Place
We've created the ultimate portfolio companion for stock investors, and it's free.
• Connect an unlimited number of Portfolios and see your total in one currency
• Be alerted to new Warning Signs or Risks via email or mobile
• Track the Fair Value of your stocks
Have feedback on this article? Concerned about the content? Get in touch with us directly. Alternatively, email editorial-team (at) simplywallst.com.
This article by Simply Wall St is general in nature. We provide commentary based on historical data and analyst forecasts only using an unbiased methodology and our articles are not intended to be financial advice. It does not constitute a recommendation to buy or sell any stock, and does not take account of your objectives, or your financial situation. We aim to bring you long-term focused analysis driven by fundamental data. Note that our analysis may not factor in the latest price-sensitive company announcements or qualitative material. Simply Wall St has no position in any stocks mentioned.
About NSEI:MOTHERSON
Samvardhana Motherson International
Engages in the development, manufacture, supply, and sale of components for automotive original equipment manufacturers in India, Germany, the United States, and internationally.
Flawless balance sheet with solid track record and pays a dividend.
