
Advertisement
Today, we'll introduce the concept of the P/E ratio for those who are learning about investing. To keep it practical, we'll show how JBM Auto Limited's (NSE:JBMA) P/E ratio could help you assess the value on offer. Based on the last twelve months, JBM Auto's P/E ratio is 13.50. That corresponds to an earnings yield of approximately 7.4%.
See our latest analysis for JBM Auto
How Do I Calculate JBM Auto's Price To Earnings Ratio?
The formula for price to earnings is:
Price to Earnings Ratio = Share Price ÷ Earnings per Share (EPS)
Or for JBM Auto:
P/E of 13.50 = INR230.85 ÷ INR17.10 (Based on the trailing twelve months to December 2019.)
Is A High Price-to-Earnings Ratio Good?
The higher the P/E ratio, the higher the price tag of a business, relative to its trailing earnings. That is not a good or a bad thing per se, but a high P/E does imply buyers are optimistic about the future.
Does JBM Auto Have A Relatively High Or Low P/E For Its Industry?
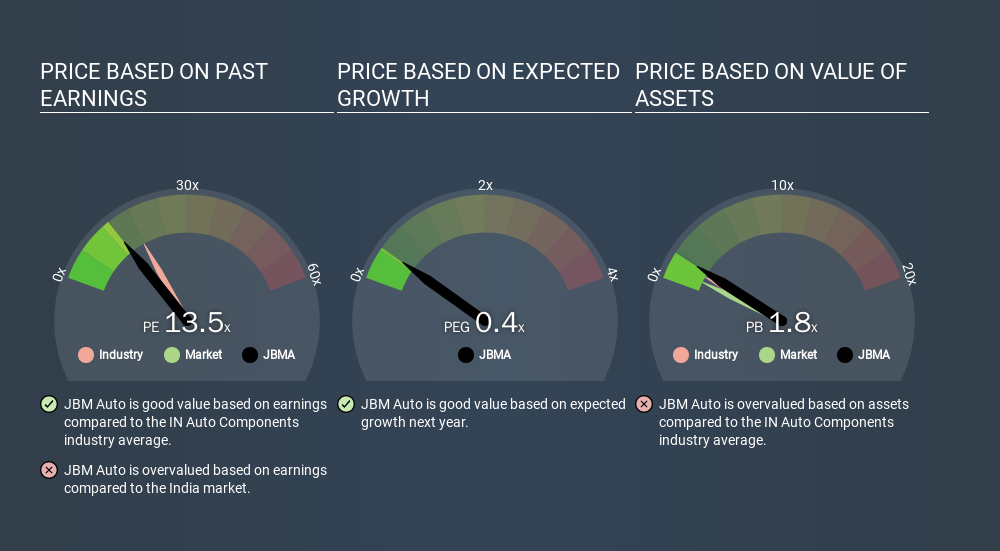
We can get an indication of market expectations by looking at the P/E ratio. We can see in the image below that the average P/E (17.5) for companies in the auto components industry is higher than JBM Auto's P/E.
JBM Auto's P/E tells us that market participants think it will not fare as well as its peers in the same industry. Many investors like to buy stocks when the market is pessimistic about their prospects. If you consider the stock interesting, further research is recommended. For example, I often monitor director buying and selling.
How Growth Rates Impact P/E Ratios
Earnings growth rates have a big influence on P/E ratios. When earnings grow, the 'E' increases, over time. That means even if the current P/E is high, it will reduce over time if the share price stays flat. So while a stock may look expensive based on past earnings, it could be cheap based on future earnings.
JBM Auto saw earnings per share decrease by 12% last year. But EPS is up 5.0% over the last 3 years. And it has shrunk its earnings per share by 2.8% per year over the last five years. This might lead to muted expectations.
Remember: P/E Ratios Don't Consider The Balance Sheet
The 'Price' in P/E reflects the market capitalization of the company. So it won't reflect the advantage of cash, or disadvantage of debt. Theoretically, a business can improve its earnings (and produce a lower P/E in the future) by investing in growth. That means taking on debt (or spending its cash).
Such expenditure might be good or bad, in the long term, but the point here is that the balance sheet is not reflected by this ratio.
How Does JBM Auto's Debt Impact Its P/E Ratio?
JBM Auto has net debt equal to 48% of its market cap. You'd want to be aware of this fact, but it doesn't bother us.
The Bottom Line On JBM Auto's P/E Ratio
JBM Auto's P/E is 13.5 which is about average (13.3) in the IN market. When you consider the lack of EPS growth last year (along with some debt), it seems the market is optimistic about the future for the business.
When the market is wrong about a stock, it gives savvy investors an opportunity. As value investor Benjamin Graham famously said, 'In the short run, the market is a voting machine but in the long run, it is a weighing machine. So this free visualization of the analyst consensus on future earnings could help you make the right decision about whether to buy, sell, or hold.
You might be able to find a better buy than JBM Auto. If you want a selection of possible winners, check out this free list of interesting companies that trade on a P/E below 20 (but have proven they can grow earnings).
If you spot an error that warrants correction, please contact the editor at editorial-team@simplywallst.com. This article by Simply Wall St is general in nature. It does not constitute a recommendation to buy or sell any stock, and does not take account of your objectives, or your financial situation. Simply Wall St has no position in the stocks mentioned.
We aim to bring you long-term focused research analysis driven by fundamental data. Note that our analysis may not factor in the latest price-sensitive company announcements or qualitative material. Thank you for reading.
About NSEI:JBMA
JBM Auto
Engages in the manufacture and sale sheet metal components, tools, dies and moulds, and buses in India and internationally.
Proven track record with imperfect balance sheet.
Similar Companies
Market Insights

Advertisement
Community Narratives
The "Molecular Pencil": Why Beam's Technology is Built to Win
Fair Value US$65.01|66.7% undervalued
DA
Community Contributor
The silent giant behind virtually every advanced chip powering AI, smartphones, and modern infrastructure.
Fair Value US$310.00|4.8% undervalued
OS
Community Contributor
ADP Stock: Solid Fundamentals, But AI Investments Test Its Margin Resilience
Fair Value US$387.77|34.5% undervalued
YI
Community Contributor
MINISO's fair value is projected at 26.69 with an anticipated PE ratio shift of 20x
Fair Value US$24.03|9.6% undervalued
BE
Community Contributor