Stock Analysis
- India
- /
- Auto Components
- /
- NSEI:CEATLTD
Is Weakness In CEAT Limited (NSE:CEATLTD) Stock A Sign That The Market Could be Wrong Given Its Strong Financial Prospects?


CEAT (NSE:CEATLTD) has had a rough week with its share price down 4.7%. However, a closer look at its sound financials might cause you to think again. Given that fundamentals usually drive long-term market outcomes, the company is worth looking at. In this article, we decided to focus on CEAT's ROE.
ROE or return on equity is a useful tool to assess how effectively a company can generate returns on the investment it received from its shareholders. In simpler terms, it measures the profitability of a company in relation to shareholder's equity.
See our latest analysis for CEAT
How Is ROE Calculated?
The formula for return on equity is:
Return on Equity = Net Profit (from continuing operations) ÷ Shareholders' Equity
So, based on the above formula, the ROE for CEAT is:
18% = ₹6.7b ÷ ₹38b (Based on the trailing twelve months to December 2023).
The 'return' is the yearly profit. That means that for every ₹1 worth of shareholders' equity, the company generated ₹0.18 in profit.
What Has ROE Got To Do With Earnings Growth?
We have already established that ROE serves as an efficient profit-generating gauge for a company's future earnings. We now need to evaluate how much profit the company reinvests or "retains" for future growth which then gives us an idea about the growth potential of the company. Generally speaking, other things being equal, firms with a high return on equity and profit retention, have a higher growth rate than firms that don’t share these attributes.
A Side By Side comparison of CEAT's Earnings Growth And 18% ROE
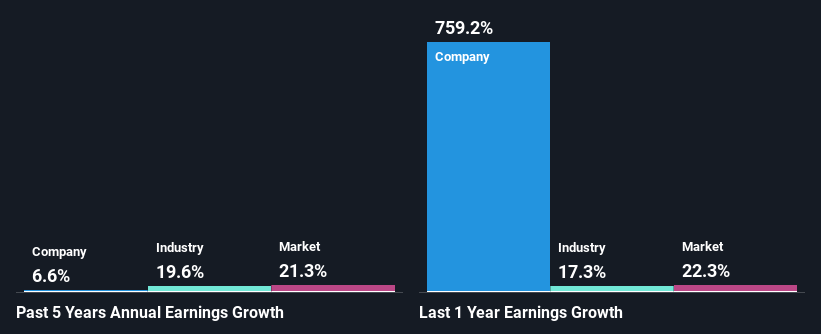
At first glance, CEAT seems to have a decent ROE. Especially when compared to the industry average of 13% the company's ROE looks pretty impressive. This probably laid the ground for CEAT's moderate 6.6% net income growth seen over the past five years.
As a next step, we compared CEAT's net income growth with the industry and were disappointed to see that the company's growth is lower than the industry average growth of 20% in the same period.
The basis for attaching value to a company is, to a great extent, tied to its earnings growth. It’s important for an investor to know whether the market has priced in the company's expected earnings growth (or decline). Doing so will help them establish if the stock's future looks promising or ominous. One good indicator of expected earnings growth is the P/E ratio which determines the price the market is willing to pay for a stock based on its earnings prospects. So, you may want to check if CEAT is trading on a high P/E or a low P/E, relative to its industry.
Is CEAT Making Efficient Use Of Its Profits?
CEAT has a low three-year median payout ratio of 17%, meaning that the company retains the remaining 83% of its profits. This suggests that the management is reinvesting most of the profits to grow the business.
Additionally, CEAT has paid dividends over a period of at least ten years which means that the company is pretty serious about sharing its profits with shareholders. Existing analyst estimates suggest that the company's future payout ratio is expected to drop to 10% over the next three years. However, the company's ROE is not expected to change by much despite the lower expected payout ratio.
Conclusion
On the whole, we feel that CEAT's performance has been quite good. In particular, it's great to see that the company is investing heavily into its business and along with a high rate of return, that has resulted in a respectable growth in its earnings. On studying current analyst estimates, we found that analysts expect the company to continue its recent growth streak. To know more about the latest analysts predictions for the company, check out this visualization of analyst forecasts for the company.
Valuation is complex, but we're helping make it simple.
Find out whether CEAT is potentially over or undervalued by checking out our comprehensive analysis, which includes fair value estimates, risks and warnings, dividends, insider transactions and financial health.
View the Free AnalysisHave feedback on this article? Concerned about the content? Get in touch with us directly. Alternatively, email editorial-team (at) simplywallst.com.
This article by Simply Wall St is general in nature. We provide commentary based on historical data and analyst forecasts only using an unbiased methodology and our articles are not intended to be financial advice. It does not constitute a recommendation to buy or sell any stock, and does not take account of your objectives, or your financial situation. We aim to bring you long-term focused analysis driven by fundamental data. Note that our analysis may not factor in the latest price-sensitive company announcements or qualitative material. Simply Wall St has no position in any stocks mentioned.
About NSEI:CEATLTD
CEAT
CEAT Limited manufactures and sells automotive tires, tubes, and flaps in India and internationally.
Solid track record average dividend payer.
