Advertisement
Did you know there are some financial metrics that can provide clues of a potential multi-bagger? Ideally, a business will show two trends; firstly a growing return on capital employed (ROCE) and secondly, an increasing amount of capital employed. If you see this, it typically means it's a company with a great business model and plenty of profitable reinvestment opportunities. Although, when we looked at E & M Computing (TLV:EMCO), it didn't seem to tick all of these boxes.
What Is Return On Capital Employed (ROCE)?
Just to clarify if you're unsure, ROCE is a metric for evaluating how much pre-tax income (in percentage terms) a company earns on the capital invested in its business. To calculate this metric for E & M Computing, this is the formula:
Return on Capital Employed = Earnings Before Interest and Tax (EBIT) ÷ (Total Assets - Current Liabilities)
0.14 = ₪43m ÷ (₪856m - ₪542m) (Based on the trailing twelve months to December 2022).
Therefore, E & M Computing has an ROCE of 14%. In isolation, that's a pretty standard return but against the IT industry average of 19%, it's not as good.
Check out our latest analysis for E & M Computing
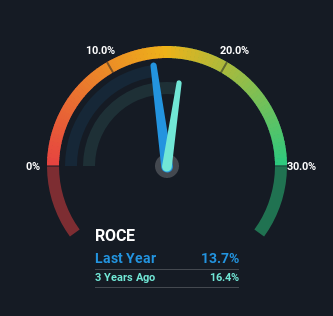
Historical performance is a great place to start when researching a stock so above you can see the gauge for E & M Computing's ROCE against it's prior returns. If you'd like to look at how E & M Computing has performed in the past in other metrics, you can view this free graph of past earnings, revenue and cash flow.
SWOT Analysis for E & M Computing
Strength
- Earnings growth over the past year exceeded the industry.
- Debt is well covered by earnings.
Weakness
- Dividend is low compared to the top 25% of dividend payers in the IT market.
- Current share price is above our estimate of fair value.
Opportunity
- EMCO's financial characteristics indicate limited near-term opportunities for shareholders.
- Lack of analyst coverage makes it difficult to determine EMCO's earnings prospects.
Threat
- Debt is not well covered by operating cash flow.
- Paying a dividend but company has no free cash flows.
How Are Returns Trending?
There hasn't been much to report for E & M Computing's returns and its level of capital employed because both metrics have been steady for the past five years. Businesses with these traits tend to be mature and steady operations because they're past the growth phase. With that in mind, unless investment picks up again in the future, we wouldn't expect E & M Computing to be a multi-bagger going forward.
On another note, while the change in ROCE trend might not scream for attention, it's interesting that the current liabilities have actually gone up over the last five years. This is intriguing because if current liabilities hadn't increased to 63% of total assets, this reported ROCE would probably be less than14% because total capital employed would be higher.The 14% ROCE could be even lower if current liabilities weren't 63% of total assets, because the the formula would show a larger base of total capital employed. Additionally, this high level of current liabilities isn't ideal because it means the company's suppliers (or short-term creditors) are effectively funding a large portion of the business.
The Key Takeaway
In summary, E & M Computing isn't compounding its earnings but is generating stable returns on the same amount of capital employed. Yet to long term shareholders the stock has gifted them an incredible 108% return in the last five years, so the market appears to be rosy about its future. However, unless these underlying trends turn more positive, we wouldn't get our hopes up too high.
Since virtually every company faces some risks, it's worth knowing what they are, and we've spotted 3 warning signs for E & M Computing (of which 2 are a bit concerning!) that you should know about.
While E & M Computing isn't earning the highest return, check out this free list of companies that are earning high returns on equity with solid balance sheets.
New: Manage All Your Stock Portfolios in One Place
We've created the ultimate portfolio companion for stock investors, and it's free.
• Connect an unlimited number of Portfolios and see your total in one currency
• Be alerted to new Warning Signs or Risks via email or mobile
• Track the Fair Value of your stocks
Have feedback on this article? Concerned about the content? Get in touch with us directly. Alternatively, email editorial-team (at) simplywallst.com.
This article by Simply Wall St is general in nature. We provide commentary based on historical data and analyst forecasts only using an unbiased methodology and our articles are not intended to be financial advice. It does not constitute a recommendation to buy or sell any stock, and does not take account of your objectives, or your financial situation. We aim to bring you long-term focused analysis driven by fundamental data. Note that our analysis may not factor in the latest price-sensitive company announcements or qualitative material. Simply Wall St has no position in any stocks mentioned.
About TASE:PEAX
Peax Solutions
Provides technological solutions in Israel.
Slight risk with mediocre balance sheet.
Similar Companies
Market Insights

Advertisement
Weekly Picks
DA


davidlsander on Nevgold ·
The U.S. Government Is Desperate for This Metal. This Tiny Miner Has It -- Its Closest Peer Is Already Worth Double.
Fair Value:US$2.1944.7% undervalued
24 followersusers have followed this narrative
0 commentsusers have commented on this narrative
2 likesusers have liked this narrative
BE

benjamin_lvieq on PayPal Holdings ·
PayPal: PayPal Doesn't Need to Grow – It Needs to Stop Falling – A Mispriced Cash Machine With a Cannibal Buyback
Fair Value:US$6512.7% undervalued
56 followersusers have followed this narrative
2 commentsusers have commented on this narrative
9 likesusers have liked this narrative
JD

JD009 on Celsius Holdings ·
From $5M to $2B: Why the 2024 Crash Was the Best Buying Opportunity in Consumer Stocks
Fair Value:US$55.4345.9% undervalued
18 followersusers have followed this narrative
1 commentusers have commented on this narrative
8 likesusers have liked this narrative
WA

Wavefarer on Accenture ·
High-quality global services company facing an AI-driven valuation reset.
Fair Value:US$30152.0% undervalued
16 followersusers have followed this narrative
0 commentsusers have commented on this narrative
4 likesusers have liked this narrative
Recently Updated Narratives
CH

chris_packerfan on Micron Technology ·
Expect Micron Technology's Valuation to Hit 1890.54 Next Year
Fair Value:US$1.89k54.9% undervalued
0 followersusers have followed this narrative
0 commentsusers have commented on this narrative
0 likesusers have liked this narrative
ES

Esteban on Hershey ·
Hershey - fortress brand-and-scale position in U.S. confectionery: protects the downside far better than it compounds the upside
Fair Value:US$79.25120.5% overvalued
3 followersusers have followed this narrative
0 commentsusers have commented on this narrative
0 likesusers have liked this narrative
RO


RockeTeller on Silver One Resources ·
Silver One Resources, US$0.96/oz for 137Moz AgEq Past-Producing Silver Project, Eric Sprott Owns 15.61%
Fair Value:CA$2.585.6% undervalued
1 followerusers have followed this narrative
0 commentsusers have commented on this narrative
0 likesusers have liked this narrative
Popular Narratives
IN


Investingwilly on Mastercard ·
Mastercard: The Best Dividend Stock You're Ignoring
Fair Value:US$75026.5% undervalued
93 followersusers have followed this narrative
1 commentusers have commented on this narrative
9 likesusers have liked this narrative
BL


BlackGoat on Cerebras Systems ·
The Wafer Giant Threatening NVIDIA's GPU Hegemony
Fair Value:US$415.5456.6% undervalued
63 followersusers have followed this narrative
3 commentsusers have commented on this narrative
11 likesusers have liked this narrative
BE
benjamin_lvieq on PayPal Holdings ·
PayPal: PayPal Doesn't Need to Grow – It Needs to Stop Falling – A Mispriced Cash Machine With a Cannibal Buyback
Fair Value:US$6512.7% undervalued
56 followersusers have followed this narrative
2 commentsusers have commented on this narrative
9 likesusers have liked this narrative
Trending Discussion
ST


StoxEurope on Koninklijke Ahold Delhaize ·
I ran Ahold Delhaize through a three-model triangulation — DCF, dividend discount, and residual inco...
1
|0
BE
benjamin_lvieq on PayPal Holdings ·
An investment case is not about loving the product. Its about price vs reality.
1
|0