
Advertisement
- Israel
- /
- Real Estate
- /
- TASE:NSTR
Norstar Holdings (TLV:NSTR shareholders incur further losses as stock declines 11% this week, taking five-year losses to 50%
In order to justify the effort of selecting individual stocks, it's worth striving to beat the returns from a market index fund. But even the best stock picker will only win with some selections. So we wouldn't blame long term Norstar Holdings Inc (TLV:NSTR) shareholders for doubting their decision to hold, with the stock down 56% over a half decade. And it's not just long term holders hurting, because the stock is down 29% in the last year. Furthermore, it's down 24% in about a quarter. That's not much fun for holders.
After losing 11% this past week, it's worth investigating the company's fundamentals to see what we can infer from past performance.
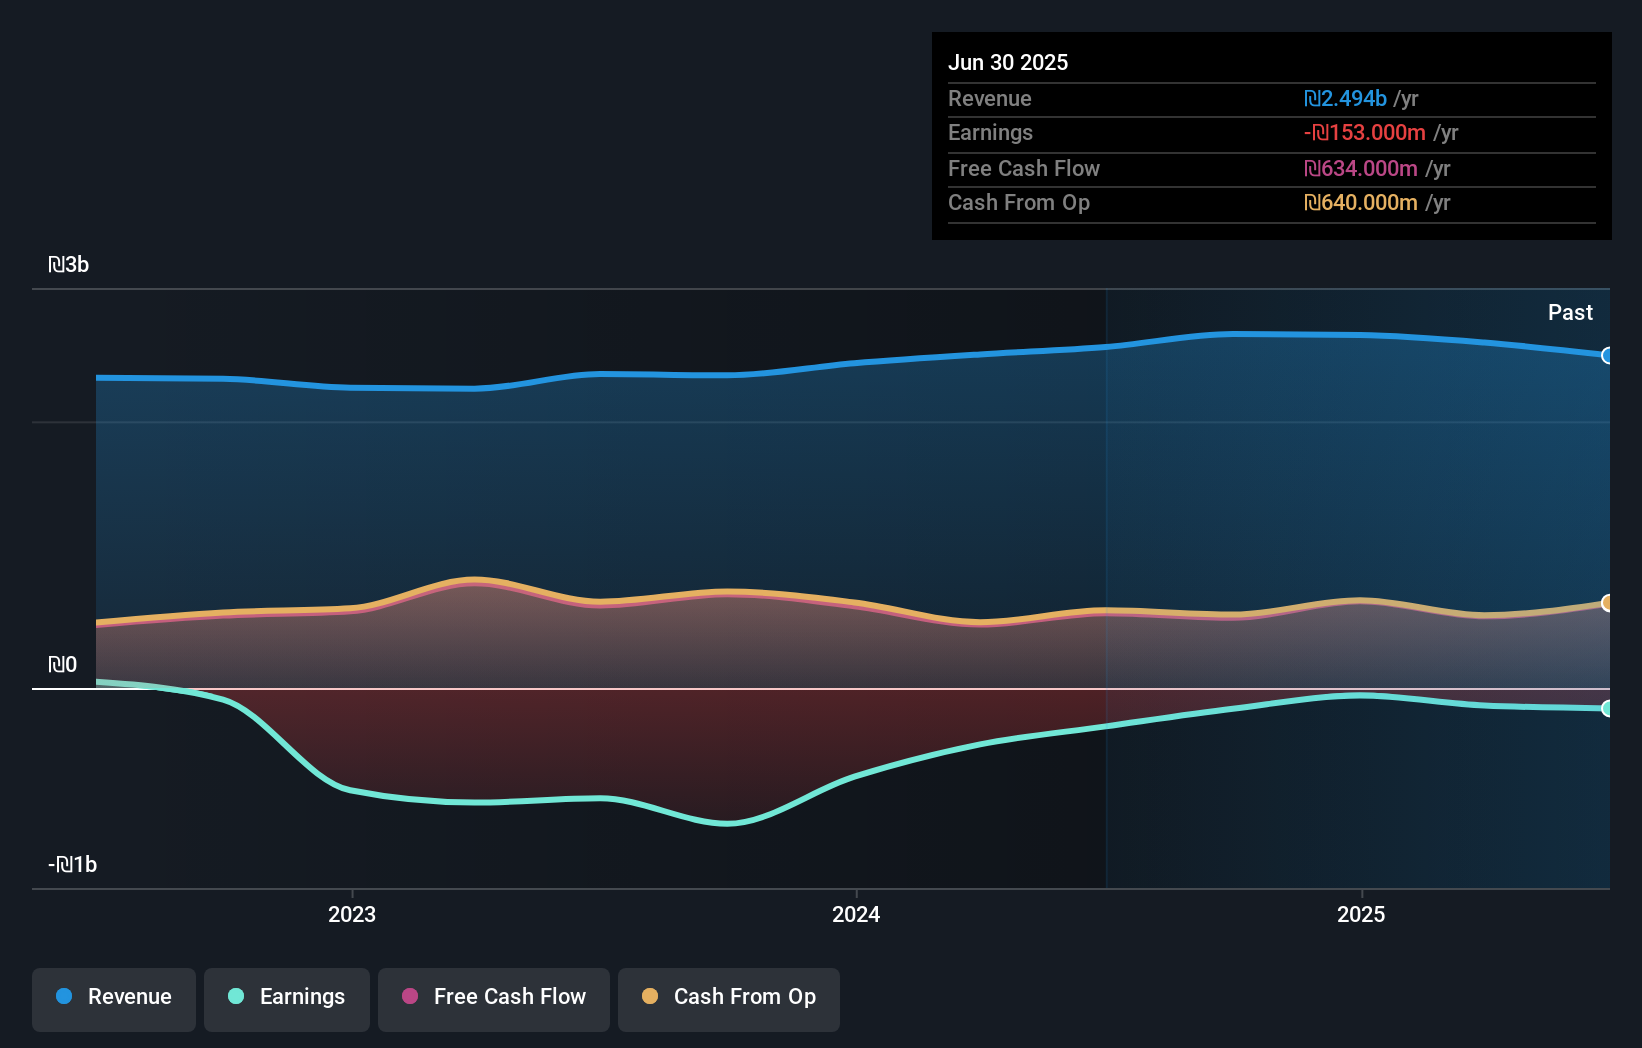
Norstar Holdings wasn't profitable in the last twelve months, it is unlikely we'll see a strong correlation between its share price and its earnings per share (EPS). Arguably revenue is our next best option. Generally speaking, companies without profits are expected to grow revenue every year, and at a good clip. That's because it's hard to be confident a company will be sustainable if revenue growth is negligible, and it never makes a profit.
In the last half decade, Norstar Holdings saw its revenue increase by 2.1% per year. That's far from impressive given all the money it is losing. This lacklustre growth has no doubt fueled the loss of 9% per year, in that time. We'd want to see proof that future revenue growth is likely to be significantly stronger before getting too interested in Norstar Holdings. However, it's possible too many in the market will ignore it, and there may be an opportunity if it starts to recover down the track.
You can see how earnings and revenue have changed over time in the image below (click on the chart to see the exact values).
Balance sheet strength is crucial. It might be well worthwhile taking a look at our free report on how its financial position has changed over time.
What About Dividends?
When looking at investment returns, it is important to consider the difference between total shareholder return (TSR) and share price return. Whereas the share price return only reflects the change in the share price, the TSR includes the value of dividends (assuming they were reinvested) and the benefit of any discounted capital raising or spin-off. So for companies that pay a generous dividend, the TSR is often a lot higher than the share price return. We note that for Norstar Holdings the TSR over the last 5 years was -50%, which is better than the share price return mentioned above. This is largely a result of its dividend payments!
A Different Perspective
Norstar Holdings shareholders are down 28% for the year (even including dividends), but the market itself is up 56%. However, keep in mind that even the best stocks will sometimes underperform the market over a twelve month period. Unfortunately, last year's performance may indicate unresolved challenges, given that it was worse than the annualised loss of 8% over the last half decade. Generally speaking long term share price weakness can be a bad sign, though contrarian investors might want to research the stock in hope of a turnaround. I find it very interesting to look at share price over the long term as a proxy for business performance. But to truly gain insight, we need to consider other information, too. To that end, you should learn about the 3 warning signs we've spotted with Norstar Holdings (including 1 which is potentially serious) .
Of course, you might find a fantastic investment by looking elsewhere. So take a peek at this free list of companies we expect will grow earnings.
Please note, the market returns quoted in this article reflect the market weighted average returns of stocks that currently trade on Israeli exchanges.
Valuation is complex, but we're here to simplify it.
Discover if Norstar Holdings might be undervalued or overvalued with our detailed analysis, featuring fair value estimates, potential risks, dividends, insider trades, and its financial condition.
Access Free AnalysisHave feedback on this article? Concerned about the content? Get in touch with us directly. Alternatively, email editorial-team (at) simplywallst.com.
This article by Simply Wall St is general in nature. We provide commentary based on historical data and analyst forecasts only using an unbiased methodology and our articles are not intended to be financial advice. It does not constitute a recommendation to buy or sell any stock, and does not take account of your objectives, or your financial situation. We aim to bring you long-term focused analysis driven by fundamental data. Note that our analysis may not factor in the latest price-sensitive company announcements or qualitative material. Simply Wall St has no position in any stocks mentioned.
About TASE:NSTR
Norstar Holdings
Develops, rents, and manages real estate properties in Northern Europe, Central and Eastern Europe, Israel, Brazil, and the United States.
Good value with low risk.
Similar Companies
Market Insights

Advertisement
Community Narratives
The company that turned a verb into a global necessity and basically runs the modern internet, digital ads, smartphones, maps, and AI.
Fair Value US$300.00|5.1% undervalued
OS
Community Contributor
Flowers Foods Pays A Fair Price For Health
Fair Value US$16.12|27.7% undervalued
NV
Community Contributor
TMX Group will thrive with 33.3% profit margin and enduring market moat
Fair Value CA$49.90|0.2% overvalued
LI
Community Contributor
The "Molecular Pencil": Why Beam's Technology is Built to Win
Fair Value US$65.01|64.4% undervalued
DA
Community Contributor