Advertisement
- Israel
- /
- Real Estate
- /
- TASE:GVYM
Gav-Yam Lands (TASE:GVYM): Exploring Valuation After Strong Third Quarter and Nine-Month Earnings Growth

Simply Wall St
Reviewed by Simply Wall St
Gav-Yam Lands (TASE:GVYM) just released its third quarter and nine-month earnings, reporting higher sales and net income compared to last year. These strong financials may prompt investors to take a closer look.
See our latest analysis for Gav-Yam Lands.
The momentum around Gav-Yam Lands has really picked up after its latest earnings beat, with its share price climbing 37.27% year to date and a stellar 1-year total shareholder return of 37.95%. After a slight dip this week, that strong longer-term performance suggests that investors are still seeing runway for growth beyond the recent results.
If recent gains from Gav-Yam Lands have you thinking about what’s next, consider broadening your search and discover fast growing stocks with high insider ownership
With such a strong run and recent outperformance, is Gav-Yam Lands now trading at a bargain, or has the market already baked in all of its future growth potential? Could there still be a buying opportunity here?
Price-to-Earnings of 14.2x: Is it justified?
Gav-Yam Lands is trading with a price-to-earnings (P/E) ratio of 14.2x based on its latest earnings, slightly undercutting the Israeli market average of 16.3x and the peer average of 16.1x. With the last close price at ₪39.15, this points to shares being reasonably valued versus local benchmarks.
The P/E ratio compares the company's current share price to its per-share earnings, offering insight into what investors are willing to pay for a shekel of profit. For real estate developers like Gav-Yam Lands, the P/E can signal how much future growth or risk the market is factoring in.
Given that Gav-Yam's earnings have seen short-term acceleration, with growth of 34.8% over the past year against a backdrop of longer-term decline, its P/E sits at a fair level relative to both the Israeli market and its industry. There is not enough data on a “fair” P/E ratio from regression analysis, but the stock’s multiple matches industry standards, suggesting the market is neither aggressively optimistic nor pessimistic about Gav-Yam’s future earnings potential.
See what the numbers say about this price — find out in our valuation breakdown.
Result: Price-to-Earnings of 14.2x (ABOUT RIGHT)
However, a recent slight pullback and shares trading just above analyst targets could limit near-term upside if market sentiment shifts or if earnings momentum slows.
Find out about the key risks to this Gav-Yam Lands narrative.
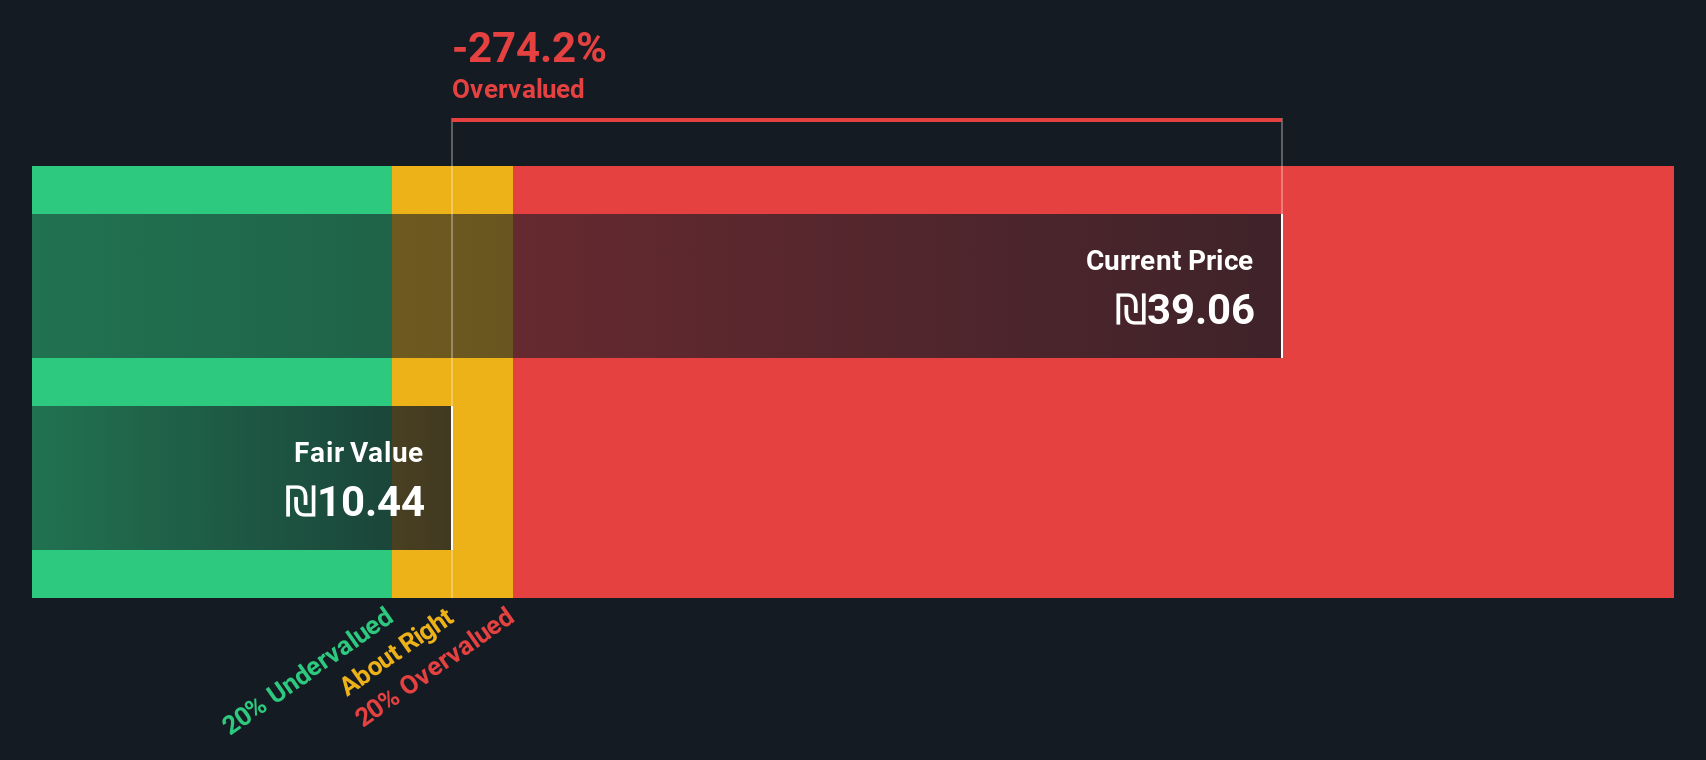
Another View: Discounted Cash Flow Signals Overvaluation
While Gav-Yam Lands’ share price appears fair compared to industry averages, our DCF model suggests something different. It calculates a fair value of just ₪10.35, far below the latest price of ₪39.15. Could the market be too optimistic about future cash flows, or is there more to the story?
Look into how the SWS DCF model arrives at its fair value.
Simply Wall St performs a discounted cash flow (DCF) on every stock in the world every day (check out Gav-Yam Lands for example). We show the entire calculation in full. You can track the result in your watchlist or portfolio and be alerted when this changes, or use our stock screener to discover 858 undervalued stocks based on their cash flows. If you save a screener we even alert you when new companies match - so you never miss a potential opportunity.
Build Your Own Gav-Yam Lands Narrative
If you see things differently or want to dig deeper on your own, you can build your own approach in just a few minutes. Do it your way
A great starting point for your Gav-Yam Lands research is our analysis highlighting 2 key rewards and 4 important warning signs that could impact your investment decision.
Looking for more investment ideas?
Seize your next big opportunity by using the Simply Wall Street Screener and uncover stocks other investors might be missing. Make your next move a smart one.
- Tap into potential by checking out these 25 AI penny stocks, which are promising breakthroughs in artificial intelligence, automation, and machine learning.
- Boost your search for stable income with these 15 dividend stocks with yields > 3%, offering attractive yields and adding resilience to your portfolio.
- Get ahead of future tech trends by exploring these 27 quantum computing stocks, featuring companies at the cutting edge of quantum computing innovation.
This article by Simply Wall St is general in nature. We provide commentary based on historical data and analyst forecasts only using an unbiased methodology and our articles are not intended to be financial advice. It does not constitute a recommendation to buy or sell any stock, and does not take account of your objectives, or your financial situation. We aim to bring you long-term focused analysis driven by fundamental data. Note that our analysis may not factor in the latest price-sensitive company announcements or qualitative material. Simply Wall St has no position in any stocks mentioned.
New: Manage All Your Stock Portfolios in One Place
We've created the ultimate portfolio companion for stock investors, and it's free.
• Connect an unlimited number of Portfolios and see your total in one currency
• Be alerted to new Warning Signs or Risks via email or mobile
• Track the Fair Value of your stocks
Have feedback on this article? Concerned about the content? Get in touch with us directly. Alternatively, email editorial-team@simplywallst.com
About TASE:GVYM
Average dividend payer with slight risk.
Market Insights

Advertisement
Community Narratives
The "Molecular Pencil": Why Beam's Technology is Built to Win
Fair Value US$65.01|65.4% undervalued
DA
Community Contributor
The silent giant behind virtually every advanced chip powering AI, smartphones, and modern infrastructure.
Fair Value US$310.00|6.1% undervalued
OS
Community Contributor
ADP Stock: Solid Fundamentals, But AI Investments Test Its Margin Resilience
Fair Value US$387.77|34.2% undervalued
YI
Community Contributor
MINISO's fair value is projected at 26.69 with an anticipated PE ratio shift of 20x
Fair Value US$24.03|9.6% undervalued
BE
Community Contributor