- Israel
- /
- Real Estate
- /
- TASE:DIMRI
Y.H. Dimri Construction & Development (TLV:DIMRI) sheds 5.1% this week, as yearly returns fall more in line with earnings growth


When you buy shares in a company, it's worth keeping in mind the possibility that it could fail, and you could lose your money. But on the bright side, if you buy shares in a high quality company at the right price, you can gain well over 100%. One great example is Y.H. Dimri Construction & Development Ltd (TLV:DIMRI) which saw its share price drive 276% higher over five years. In the last week shares have slid back 5.1%.
While the stock has fallen 5.1% this week, it's worth focusing on the longer term and seeing if the stocks historical returns have been driven by the underlying fundamentals.
See our latest analysis for Y.H. Dimri Construction & Development
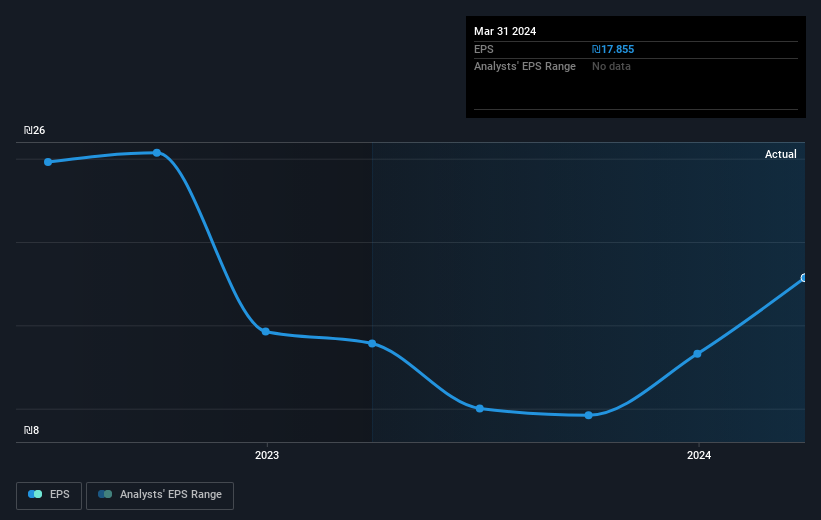
While markets are a powerful pricing mechanism, share prices reflect investor sentiment, not just underlying business performance. One flawed but reasonable way to assess how sentiment around a company has changed is to compare the earnings per share (EPS) with the share price.
During five years of share price growth, Y.H. Dimri Construction & Development achieved compound earnings per share (EPS) growth of 13% per year. This EPS growth is slower than the share price growth of 30% per year, over the same period. This suggests that market participants hold the company in higher regard, these days. And that's hardly shocking given the track record of growth.
The graphic below depicts how EPS has changed over time (unveil the exact values by clicking on the image).
Dive deeper into Y.H. Dimri Construction & Development's key metrics by checking this interactive graph of Y.H. Dimri Construction & Development's earnings, revenue and cash flow.
What About Dividends?
It is important to consider the total shareholder return, as well as the share price return, for any given stock. The TSR incorporates the value of any spin-offs or discounted capital raisings, along with any dividends, based on the assumption that the dividends are reinvested. So for companies that pay a generous dividend, the TSR is often a lot higher than the share price return. We note that for Y.H. Dimri Construction & Development the TSR over the last 5 years was 316%, which is better than the share price return mentioned above. And there's no prize for guessing that the dividend payments largely explain the divergence!
A Different Perspective
We're pleased to report that Y.H. Dimri Construction & Development shareholders have received a total shareholder return of 20% over one year. And that does include the dividend. However, the TSR over five years, coming in at 33% per year, is even more impressive. Potential buyers might understandably feel they've missed the opportunity, but it's always possible business is still firing on all cylinders. It's always interesting to track share price performance over the longer term. But to understand Y.H. Dimri Construction & Development better, we need to consider many other factors. To that end, you should learn about the 2 warning signs we've spotted with Y.H. Dimri Construction & Development (including 1 which is a bit concerning) .
If you would prefer to check out another company -- one with potentially superior financials -- then do not miss this free list of companies that have proven they can grow earnings.
Please note, the market returns quoted in this article reflect the market weighted average returns of stocks that currently trade on Israeli exchanges.
New: Manage All Your Stock Portfolios in One Place
We've created the ultimate portfolio companion for stock investors, and it's free.
• Connect an unlimited number of Portfolios and see your total in one currency
• Be alerted to new Warning Signs or Risks via email or mobile
• Track the Fair Value of your stocks
Have feedback on this article? Concerned about the content? Get in touch with us directly. Alternatively, email editorial-team (at) simplywallst.com.
This article by Simply Wall St is general in nature. We provide commentary based on historical data and analyst forecasts only using an unbiased methodology and our articles are not intended to be financial advice. It does not constitute a recommendation to buy or sell any stock, and does not take account of your objectives, or your financial situation. We aim to bring you long-term focused analysis driven by fundamental data. Note that our analysis may not factor in the latest price-sensitive company announcements or qualitative material. Simply Wall St has no position in any stocks mentioned.
Have feedback on this article? Concerned about the content? Get in touch with us directly. Alternatively, email editorial-team@simplywallst.com
About TASE:DIMRI
Y.H. Dimri Construction & Development
Operates as a real estate company in Israel, Romania, and the Czech Republic.
Solid track record with mediocre balance sheet.

