- Israel
- /
- Real Estate
- /
- TASE:AURA
Aura Investments (TLV:AURA) delivers shareholders massive 42% CAGR over 5 years, surging 8.1% in the last week alone


We think all investors should try to buy and hold high quality multi-year winners. While not every stock performs well, when investors win, they can win big. For example, the Aura Investments Ltd. (TLV:AURA) share price is up a whopping 445% in the last half decade, a handsome return for long term holders. If that doesn't get you thinking about long term investing, we don't know what will. It's also good to see the share price up 25% over the last quarter.
Since it's been a strong week for Aura Investments shareholders, let's have a look at trend of the longer term fundamentals.
View our latest analysis for Aura Investments
While the efficient markets hypothesis continues to be taught by some, it has been proven that markets are over-reactive dynamic systems, and investors are not always rational. One way to examine how market sentiment has changed over time is to look at the interaction between a company's share price and its earnings per share (EPS).
During the last half decade, Aura Investments became profitable. That kind of transition can be an inflection point that justifies a strong share price gain, just as we have seen here. Since the company was unprofitable five years ago, but not three years ago, it's worth taking a look at the returns in the last three years, too. We can see that the Aura Investments share price is up 391% in the last three years. Meanwhile, EPS is up 38% per year. Notably, the EPS growth has been slower than the annualised share price gain of 70% over three years. So it's fair to assume the market has a higher opinion of the business than it did three years ago.
The graphic below depicts how EPS has changed over time (unveil the exact values by clicking on the image).
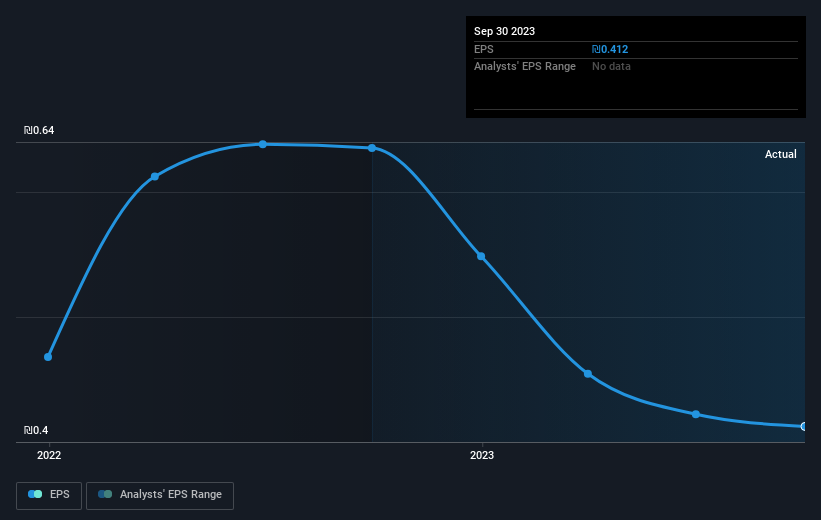
Dive deeper into Aura Investments' key metrics by checking this interactive graph of Aura Investments's earnings, revenue and cash flow.
What About Dividends?
As well as measuring the share price return, investors should also consider the total shareholder return (TSR). The TSR is a return calculation that accounts for the value of cash dividends (assuming that any dividend received was reinvested) and the calculated value of any discounted capital raisings and spin-offs. Arguably, the TSR gives a more comprehensive picture of the return generated by a stock. We note that for Aura Investments the TSR over the last 5 years was 487%, which is better than the share price return mentioned above. And there's no prize for guessing that the dividend payments largely explain the divergence!
A Different Perspective
It's nice to see that Aura Investments shareholders have received a total shareholder return of 94% over the last year. Of course, that includes the dividend. That's better than the annualised return of 42% over half a decade, implying that the company is doing better recently. In the best case scenario, this may hint at some real business momentum, implying that now could be a great time to delve deeper. I find it very interesting to look at share price over the long term as a proxy for business performance. But to truly gain insight, we need to consider other information, too. To that end, you should learn about the 3 warning signs we've spotted with Aura Investments (including 2 which are potentially serious) .
If you are like me, then you will not want to miss this free list of growing companies that insiders are buying.
Please note, the market returns quoted in this article reflect the market weighted average returns of stocks that currently trade on Israeli exchanges.
New: Manage All Your Stock Portfolios in One Place
We've created the ultimate portfolio companion for stock investors, and it's free.
• Connect an unlimited number of Portfolios and see your total in one currency
• Be alerted to new Warning Signs or Risks via email or mobile
• Track the Fair Value of your stocks
Have feedback on this article? Concerned about the content? Get in touch with us directly. Alternatively, email editorial-team (at) simplywallst.com.
This article by Simply Wall St is general in nature. We provide commentary based on historical data and analyst forecasts only using an unbiased methodology and our articles are not intended to be financial advice. It does not constitute a recommendation to buy or sell any stock, and does not take account of your objectives, or your financial situation. We aim to bring you long-term focused analysis driven by fundamental data. Note that our analysis may not factor in the latest price-sensitive company announcements or qualitative material. Simply Wall St has no position in any stocks mentioned.
About TASE:AURA
Aura Investments
Together with its subsidiaries engages in locating, initiating, planning, and building projects in the field of residential real estate in Israel and internationally.
Proven track record with mediocre balance sheet.
