Palram Industries (1990) (TLV:PLRM) jumps 16% this week, taking five-year gains to 473%


We think all investors should try to buy and hold high quality multi-year winners. While not every stock performs well, when investors win, they can win big. For example, the Palram Industries (1990) Ltd (TLV:PLRM) share price is up a whopping 327% in the last half decade, a handsome return for long term holders. And this is just one example of the epic gains achieved by some long term investors. Also pleasing for shareholders was the 24% gain in the last three months. This could be related to the recent financial results, released recently - you can catch up on the most recent data by reading our company report.
After a strong gain in the past week, it's worth seeing if longer term returns have been driven by improving fundamentals.
See our latest analysis for Palram Industries (1990)
While the efficient markets hypothesis continues to be taught by some, it has been proven that markets are over-reactive dynamic systems, and investors are not always rational. By comparing earnings per share (EPS) and share price changes over time, we can get a feel for how investor attitudes to a company have morphed over time.
During the last half decade, Palram Industries (1990) became profitable. Sometimes, the start of profitability is a major inflection point that can signal fast earnings growth to come, which in turn justifies very strong share price gains.
You can see below how EPS has changed over time (discover the exact values by clicking on the image).
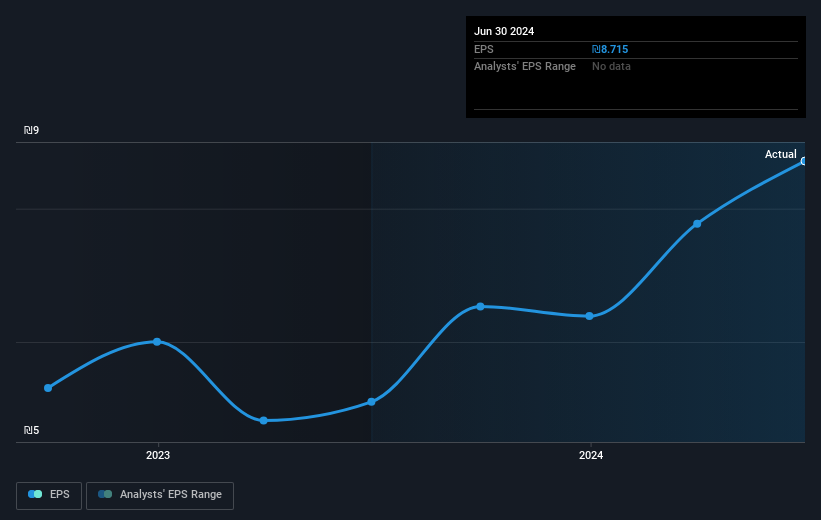
Dive deeper into Palram Industries (1990)'s key metrics by checking this interactive graph of Palram Industries (1990)'s earnings, revenue and cash flow.
What About Dividends?
It is important to consider the total shareholder return, as well as the share price return, for any given stock. The TSR incorporates the value of any spin-offs or discounted capital raisings, along with any dividends, based on the assumption that the dividends are reinvested. It's fair to say that the TSR gives a more complete picture for stocks that pay a dividend. We note that for Palram Industries (1990) the TSR over the last 5 years was 473%, which is better than the share price return mentioned above. And there's no prize for guessing that the dividend payments largely explain the divergence!
A Different Perspective
It's good to see that Palram Industries (1990) has rewarded shareholders with a total shareholder return of 126% in the last twelve months. That's including the dividend. Since the one-year TSR is better than the five-year TSR (the latter coming in at 42% per year), it would seem that the stock's performance has improved in recent times. In the best case scenario, this may hint at some real business momentum, implying that now could be a great time to delve deeper. I find it very interesting to look at share price over the long term as a proxy for business performance. But to truly gain insight, we need to consider other information, too. Take risks, for example - Palram Industries (1990) has 1 warning sign we think you should be aware of.
But note: Palram Industries (1990) may not be the best stock to buy. So take a peek at this free list of interesting companies with past earnings growth (and further growth forecast).
Please note, the market returns quoted in this article reflect the market weighted average returns of stocks that currently trade on Israeli exchanges.
New: Manage All Your Stock Portfolios in One Place
We've created the ultimate portfolio companion for stock investors, and it's free.
• Connect an unlimited number of Portfolios and see your total in one currency
• Be alerted to new Warning Signs or Risks via email or mobile
• Track the Fair Value of your stocks
Have feedback on this article? Concerned about the content? Get in touch with us directly. Alternatively, email editorial-team (at) simplywallst.com.
This article by Simply Wall St is general in nature. We provide commentary based on historical data and analyst forecasts only using an unbiased methodology and our articles are not intended to be financial advice. It does not constitute a recommendation to buy or sell any stock, and does not take account of your objectives, or your financial situation. We aim to bring you long-term focused analysis driven by fundamental data. Note that our analysis may not factor in the latest price-sensitive company announcements or qualitative material. Simply Wall St has no position in any stocks mentioned.
About TASE:PLRM
Palram Industries (1990)
Manufactures and sells thermoplastic sheets, and panel systems, and finished products in Israel and internationally.
Flawless balance sheet with solid track record and pays a dividend.

