The one-year earnings decline is not helping Kafrit Industries (1993)'s (TLV:KAFR share price, as stock falls another 14% in past week


The simplest way to benefit from a rising market is to buy an index fund. But if you buy individual stocks, you can do both better or worse than that. For example, the Kafrit Industries (1993) Ltd (TLV:KAFR) share price is down 42% in the last year. That falls noticeably short of the market decline of around 12%. However, the longer term returns haven't been so bad, with the stock down 15% in the last three years. Furthermore, it's down 23% in about a quarter. That's not much fun for holders.
Given the past week has been tough on shareholders, let's investigate the fundamentals and see what we can learn.
See our latest analysis for Kafrit Industries (1993)
While markets are a powerful pricing mechanism, share prices reflect investor sentiment, not just underlying business performance. One imperfect but simple way to consider how the market perception of a company has shifted is to compare the change in the earnings per share (EPS) with the share price movement.
Unfortunately Kafrit Industries (1993) reported an EPS drop of 56% for the last year. This fall in the EPS is significantly worse than the 42% the share price fall. So despite the weak per-share profits, some investors are probably relieved the situation wasn't more difficult.
The image below shows how EPS has tracked over time (if you click on the image you can see greater detail).
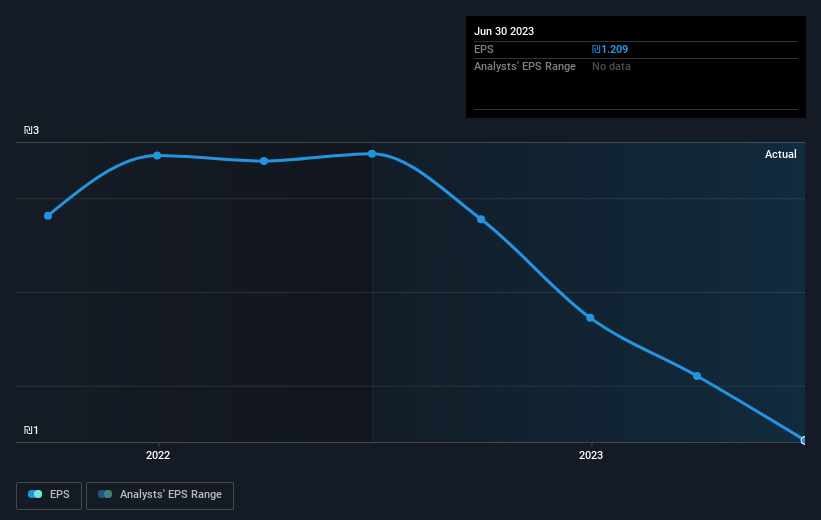
This free interactive report on Kafrit Industries (1993)'s earnings, revenue and cash flow is a great place to start, if you want to investigate the stock further.
What About Dividends?
When looking at investment returns, it is important to consider the difference between total shareholder return (TSR) and share price return. The TSR is a return calculation that accounts for the value of cash dividends (assuming that any dividend received was reinvested) and the calculated value of any discounted capital raisings and spin-offs. It's fair to say that the TSR gives a more complete picture for stocks that pay a dividend. In the case of Kafrit Industries (1993), it has a TSR of -40% for the last 1 year. That exceeds its share price return that we previously mentioned. This is largely a result of its dividend payments!
A Different Perspective
While the broader market lost about 12% in the twelve months, Kafrit Industries (1993) shareholders did even worse, losing 40% (even including dividends). Having said that, it's inevitable that some stocks will be oversold in a falling market. The key is to keep your eyes on the fundamental developments. Unfortunately, last year's performance may indicate unresolved challenges, given that it was worse than the annualised loss of 2% over the last half decade. Generally speaking long term share price weakness can be a bad sign, though contrarian investors might want to research the stock in hope of a turnaround. I find it very interesting to look at share price over the long term as a proxy for business performance. But to truly gain insight, we need to consider other information, too. Consider risks, for instance. Every company has them, and we've spotted 4 warning signs for Kafrit Industries (1993) you should know about.
Of course Kafrit Industries (1993) may not be the best stock to buy. So you may wish to see this free collection of growth stocks.
Please note, the market returns quoted in this article reflect the market weighted average returns of stocks that currently trade on Israeli exchanges.
Valuation is complex, but we're here to simplify it.
Discover if Kafrit Industries (1993) might be undervalued or overvalued with our detailed analysis, featuring fair value estimates, potential risks, dividends, insider trades, and its financial condition.
Access Free AnalysisHave feedback on this article? Concerned about the content? Get in touch with us directly. Alternatively, email editorial-team (at) simplywallst.com.
This article by Simply Wall St is general in nature. We provide commentary based on historical data and analyst forecasts only using an unbiased methodology and our articles are not intended to be financial advice. It does not constitute a recommendation to buy or sell any stock, and does not take account of your objectives, or your financial situation. We aim to bring you long-term focused analysis driven by fundamental data. Note that our analysis may not factor in the latest price-sensitive company announcements or qualitative material. Simply Wall St has no position in any stocks mentioned.
About TASE:KAFR
Kafrit Industries (1993)
Offers customized masterbatches and compounds in Israel and internationally.
Solid track record with adequate balance sheet and pays a dividend.
