- Israel
- /
- Basic Materials
- /
- TASE:ACKR
54% earnings growth over 1 year has not materialized into gains for Ackerstein Group (TLV:ACKR) shareholders over that period

Investors can approximate the average market return by buying an index fund. When you buy individual stocks, you can make higher profits, but you also face the risk of under-performance. For example, the Ackerstein Group Ltd (TLV:ACKR) share price is down 32% in the last year. That's disappointing when you consider the market declined 11%. We wouldn't rush to judgement on Ackerstein Group because we don't have a long term history to look at. Even worse, it's down 20% in about a month, which isn't fun at all.
After losing 12% this past week, it's worth investigating the company's fundamentals to see what we can infer from past performance.
Check out our latest analysis for Ackerstein Group
To paraphrase Benjamin Graham: Over the short term the market is a voting machine, but over the long term it's a weighing machine. By comparing earnings per share (EPS) and share price changes over time, we can get a feel for how investor attitudes to a company have morphed over time.
Even though the Ackerstein Group share price is down over the year, its EPS actually improved. It's quite possible that growth expectations may have been unreasonable in the past.
It's fair to say that the share price does not seem to be reflecting the EPS growth. So it's easy to justify a look at some other metrics.
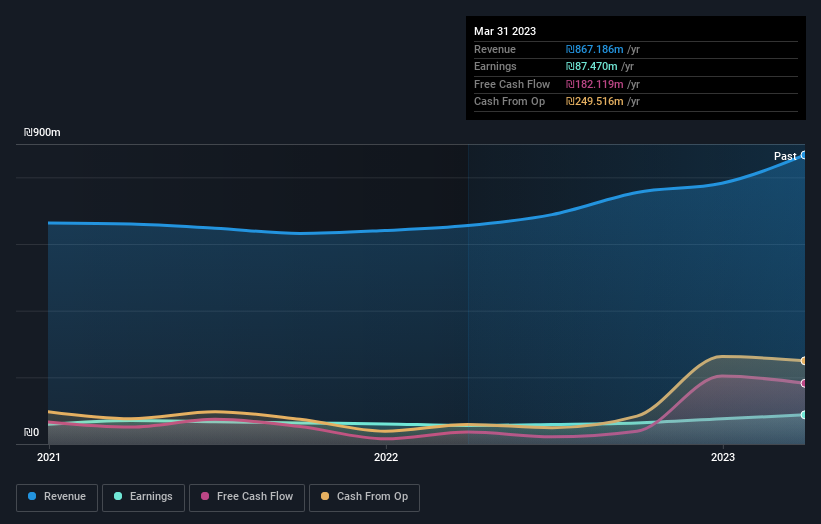
Ackerstein Group's revenue is actually up 32% over the last year. Since the fundamental metrics don't readily explain the share price drop, there might be an opportunity if the market has overreacted.
The image below shows how earnings and revenue have tracked over time (if you click on the image you can see greater detail).
You can see how its balance sheet has strengthened (or weakened) over time in this free interactive graphic.
What About Dividends?
When looking at investment returns, it is important to consider the difference between total shareholder return (TSR) and share price return. The TSR is a return calculation that accounts for the value of cash dividends (assuming that any dividend received was reinvested) and the calculated value of any discounted capital raisings and spin-offs. So for companies that pay a generous dividend, the TSR is often a lot higher than the share price return. As it happens, Ackerstein Group's TSR for the last 1 year was -30%, which exceeds the share price return mentioned earlier. And there's no prize for guessing that the dividend payments largely explain the divergence!
A Different Perspective
Ackerstein Group shareholders are down 30% for the year (even including dividends), even worse than the market loss of 11%. That's disappointing, but it's worth keeping in mind that the market-wide selling wouldn't have helped. With the stock down 14% over the last three months, the market doesn't seem to believe that the company has solved all its problems. Given the relatively short history of this stock, we'd remain pretty wary until we see some strong business performance. While it is well worth considering the different impacts that market conditions can have on the share price, there are other factors that are even more important. Consider for instance, the ever-present spectre of investment risk. We've identified 3 warning signs with Ackerstein Group (at least 1 which shouldn't be ignored) , and understanding them should be part of your investment process.
We will like Ackerstein Group better if we see some big insider buys. While we wait, check out this free list of growing companies with considerable, recent, insider buying.
Please note, the market returns quoted in this article reflect the market weighted average returns of stocks that currently trade on Israeli exchanges.
New: Manage All Your Stock Portfolios in One Place
We've created the ultimate portfolio companion for stock investors, and it's free.
• Connect an unlimited number of Portfolios and see your total in one currency
• Be alerted to new Warning Signs or Risks via email or mobile
• Track the Fair Value of your stocks
Have feedback on this article? Concerned about the content? Get in touch with us directly. Alternatively, email editorial-team (at) simplywallst.com.
This article by Simply Wall St is general in nature. We provide commentary based on historical data and analyst forecasts only using an unbiased methodology and our articles are not intended to be financial advice. It does not constitute a recommendation to buy or sell any stock, and does not take account of your objectives, or your financial situation. We aim to bring you long-term focused analysis driven by fundamental data. Note that our analysis may not factor in the latest price-sensitive company announcements or qualitative material. Simply Wall St has no position in any stocks mentioned.
About TASE:ACKR
Ackerstein Group
Operates in the infrastructure, construction, and environmental development sector.
Excellent balance sheet with questionable track record.
