Stock Analysis
- Israel
- /
- Oil and Gas
- /
- TASE:DLEKG
Are Delek Group Ltd.'s (TLV:DLEKG) Fundamentals Good Enough to Warrant Buying Given The Stock's Recent Weakness?

Delek Group (TLV:DLEKG) has had a rough three months with its share price down 4.3%. However, the company's fundamentals look pretty decent, and long-term financials are usually aligned with future market price movements. In this article, we decided to focus on Delek Group's ROE.
Return on Equity or ROE is a test of how effectively a company is growing its value and managing investors’ money. In simpler terms, it measures the profitability of a company in relation to shareholder's equity.
View our latest analysis for Delek Group
How Do You Calculate Return On Equity?
The formula for ROE is:
Return on Equity = Net Profit (from continuing operations) ÷ Shareholders' Equity
So, based on the above formula, the ROE for Delek Group is:
8.2% = ₪1.3b ÷ ₪15b (Based on the trailing twelve months to September 2023).
The 'return' is the profit over the last twelve months. So, this means that for every ₪1 of its shareholder's investments, the company generates a profit of ₪0.08.
What Is The Relationship Between ROE And Earnings Growth?
We have already established that ROE serves as an efficient profit-generating gauge for a company's future earnings. Based on how much of its profits the company chooses to reinvest or "retain", we are then able to evaluate a company's future ability to generate profits. Generally speaking, other things being equal, firms with a high return on equity and profit retention, have a higher growth rate than firms that don’t share these attributes.
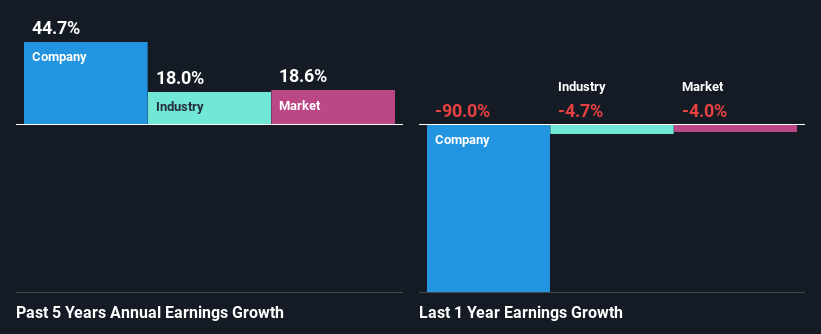
Delek Group's Earnings Growth And 8.2% ROE
On the face of it, Delek Group's ROE is not much to talk about. We then compared the company's ROE to the broader industry and were disappointed to see that the ROE is lower than the industry average of 21%. In spite of this, Delek Group was able to grow its net income considerably, at a rate of 45% in the last five years. We reckon that there could be other factors at play here. For example, it is possible that the company's management has made some good strategic decisions, or that the company has a low payout ratio.
Next, on comparing with the industry net income growth, we found that Delek Group's growth is quite high when compared to the industry average growth of 18% in the same period, which is great to see.
Earnings growth is a huge factor in stock valuation. What investors need to determine next is if the expected earnings growth, or the lack of it, is already built into the share price. This then helps them determine if the stock is placed for a bright or bleak future. One good indicator of expected earnings growth is the P/E ratio which determines the price the market is willing to pay for a stock based on its earnings prospects. So, you may want to check if Delek Group is trading on a high P/E or a low P/E, relative to its industry.
Is Delek Group Efficiently Re-investing Its Profits?
Delek Group's ' three-year median payout ratio is on the lower side at 11% implying that it is retaining a higher percentage (89%) of its profits. So it seems like the management is reinvesting profits heavily to grow its business and this reflects in its earnings growth number.
Moreover, Delek Group is determined to keep sharing its profits with shareholders which we infer from its long history of paying a dividend for at least ten years.
Conclusion
Overall, we feel that Delek Group certainly does have some positive factors to consider. Despite its low rate of return, the fact that the company reinvests a very high portion of its profits into its business, no doubt contributed to its high earnings growth. While we won't completely dismiss the company, what we would do, is try to ascertain how risky the business is to make a more informed decision around the company. You can see the 5 risks we have identified for Delek Group by visiting our risks dashboard for free on our platform here.
Valuation is complex, but we're helping make it simple.
Find out whether Delek Group is potentially over or undervalued by checking out our comprehensive analysis, which includes fair value estimates, risks and warnings, dividends, insider transactions and financial health.
View the Free AnalysisHave feedback on this article? Concerned about the content? Get in touch with us directly. Alternatively, email editorial-team (at) simplywallst.com.
This article by Simply Wall St is general in nature. We provide commentary based on historical data and analyst forecasts only using an unbiased methodology and our articles are not intended to be financial advice. It does not constitute a recommendation to buy or sell any stock, and does not take account of your objectives, or your financial situation. We aim to bring you long-term focused analysis driven by fundamental data. Note that our analysis may not factor in the latest price-sensitive company announcements or qualitative material. Simply Wall St has no position in any stocks mentioned.
About TASE:DLEKG
Delek Group
Delek Group Ltd., an energy company, engages in the exploration, development, production, and marketing of oil and gas in Israel and internationally.
Good value with adequate balance sheet.

