- Israel
- /
- Diversified Financial
- /
- TASE:EMDV
The 41% return delivered to Emilia Development (O.F.G)'s (TLV:EMDV) shareholders actually lagged YoY earnings growth


By buying an index fund, investors can approximate the average market return. But many of us dare to dream of bigger returns, and build a portfolio ourselves. For example, Emilia Development (O.F.G) Ltd. (TLV:EMDV) shareholders have seen the share price rise 33% over three years, well in excess of the market return (16%, not including dividends).
On the back of a solid 7-day performance, let's check what role the company's fundamentals have played in driving long term shareholder returns.
View our latest analysis for Emilia Development (O.F.G)
While markets are a powerful pricing mechanism, share prices reflect investor sentiment, not just underlying business performance. One imperfect but simple way to consider how the market perception of a company has shifted is to compare the change in the earnings per share (EPS) with the share price movement.
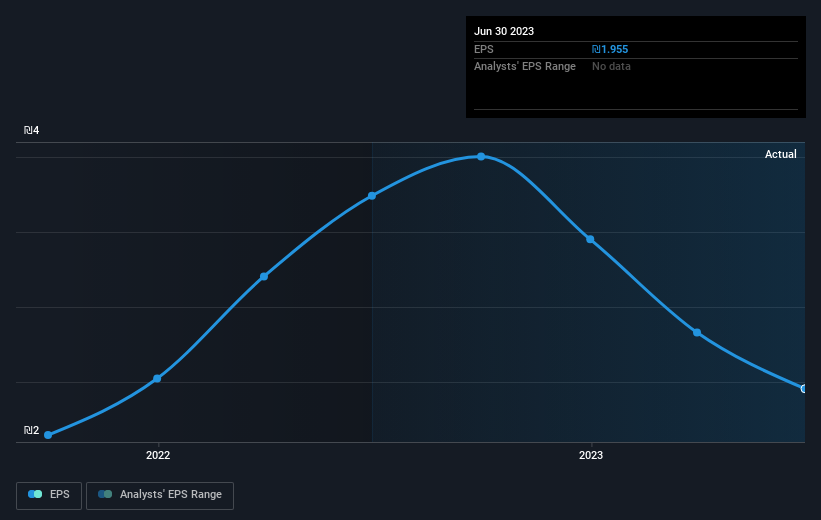
During three years of share price growth, Emilia Development (O.F.G) achieved compound earnings per share growth of 88% per year. This EPS growth is higher than the 10% average annual increase in the share price. So it seems investors have become more cautious about the company, over time.
The company's earnings per share (over time) is depicted in the image below (click to see the exact numbers).
This free interactive report on Emilia Development (O.F.G)'s earnings, revenue and cash flow is a great place to start, if you want to investigate the stock further.
What About Dividends?
When looking at investment returns, it is important to consider the difference between total shareholder return (TSR) and share price return. The TSR incorporates the value of any spin-offs or discounted capital raisings, along with any dividends, based on the assumption that the dividends are reinvested. It's fair to say that the TSR gives a more complete picture for stocks that pay a dividend. We note that for Emilia Development (O.F.G) the TSR over the last 3 years was 41%, which is better than the share price return mentioned above. And there's no prize for guessing that the dividend payments largely explain the divergence!
A Different Perspective
Although it hurts that Emilia Development (O.F.G) returned a loss of 3.5% in the last twelve months, the broader market was actually worse, returning a loss of 7.1%. Longer term investors wouldn't be so upset, since they would have made 1.0%, each year, over five years. In the best case scenario the last year is just a temporary blip on the journey to a brighter future. While it is well worth considering the different impacts that market conditions can have on the share price, there are other factors that are even more important. To that end, you should be aware of the 2 warning signs we've spotted with Emilia Development (O.F.G) .
Of course Emilia Development (O.F.G) may not be the best stock to buy. So you may wish to see this free collection of growth stocks.
Please note, the market returns quoted in this article reflect the market weighted average returns of stocks that currently trade on Israeli exchanges.
Valuation is complex, but we're here to simplify it.
Discover if Emilia Development (O.F.G) might be undervalued or overvalued with our detailed analysis, featuring fair value estimates, potential risks, dividends, insider trades, and its financial condition.
Access Free AnalysisHave feedback on this article? Concerned about the content? Get in touch with us directly. Alternatively, email editorial-team (at) simplywallst.com.
This article by Simply Wall St is general in nature. We provide commentary based on historical data and analyst forecasts only using an unbiased methodology and our articles are not intended to be financial advice. It does not constitute a recommendation to buy or sell any stock, and does not take account of your objectives, or your financial situation. We aim to bring you long-term focused analysis driven by fundamental data. Note that our analysis may not factor in the latest price-sensitive company announcements or qualitative material. Simply Wall St has no position in any stocks mentioned.
About TASE:EMDV
Emilia Development (O.F.G)
Manages a portfolio of investments in the industrial services in Israel.
Adequate balance sheet second-rate dividend payer.
