- Israel
- /
- Hospitality
- /
- TASE:QNCO
Is Y.Z. Queenco Ltd.'s (TLV:QNCO) Recent Price Movement Underpinned By Its Weak Fundamentals?


With its stock down 31% over the past three months, it is easy to disregard Y.Z. Queenco (TLV:QNCO). We, however decided to study the company's financials to determine if they have got anything to do with the price decline. Stock prices are usually driven by a company’s financial performance over the long term, and therefore we decided to pay more attention to the company's financial performance. Particularly, we will be paying attention to Y.Z. Queenco's ROE today.
Return on equity or ROE is a key measure used to assess how efficiently a company's management is utilizing the company's capital. In other words, it is a profitability ratio which measures the rate of return on the capital provided by the company's shareholders.
Check out our latest analysis for Y.Z. Queenco
How Do You Calculate Return On Equity?
ROE can be calculated by using the formula:
Return on Equity = Net Profit (from continuing operations) ÷ Shareholders' Equity
So, based on the above formula, the ROE for Y.Z. Queenco is:
3.5% = ₪3.5m ÷ ₪99m (Based on the trailing twelve months to December 2022).
The 'return' is the amount earned after tax over the last twelve months. Another way to think of that is that for every ₪1 worth of equity, the company was able to earn ₪0.03 in profit.
What Has ROE Got To Do With Earnings Growth?
Thus far, we have learned that ROE measures how efficiently a company is generating its profits. We now need to evaluate how much profit the company reinvests or "retains" for future growth which then gives us an idea about the growth potential of the company. Generally speaking, other things being equal, firms with a high return on equity and profit retention, have a higher growth rate than firms that don’t share these attributes.
Y.Z. Queenco's Earnings Growth And 3.5% ROE
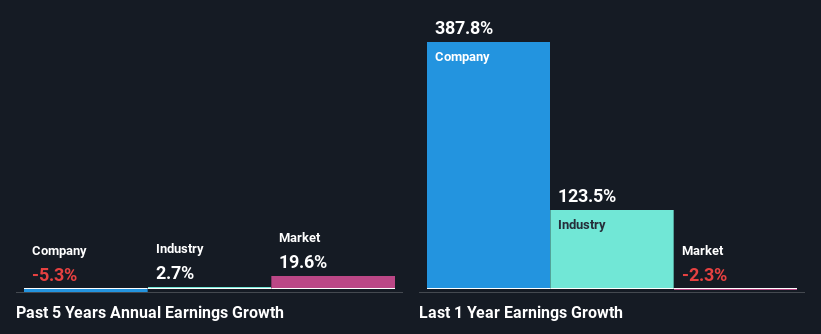
As you can see, Y.Z. Queenco's ROE looks pretty weak. Even compared to the average industry ROE of 16%, the company's ROE is quite dismal. For this reason, Y.Z. Queenco's five year net income decline of 5.3% is not surprising given its lower ROE. We reckon that there could also be other factors at play here. For example, the business has allocated capital poorly, or that the company has a very high payout ratio.
That being said, we compared Y.Z. Queenco's performance with the industry and were concerned when we found that while the company has shrunk its earnings, the industry has grown its earnings at a rate of 2.7% in the same 5-year period.
Earnings growth is a huge factor in stock valuation. It’s important for an investor to know whether the market has priced in the company's expected earnings growth (or decline). Doing so will help them establish if the stock's future looks promising or ominous. If you're wondering about Y.Z. Queenco's's valuation, check out this gauge of its price-to-earnings ratio, as compared to its industry.
Is Y.Z. Queenco Using Its Retained Earnings Effectively?
Y.Z. Queenco doesn't pay any dividend, meaning that the company is keeping all of its profits, which makes us wonder why it is retaining its earnings if it can't use them to grow its business. So there might be other factors at play here which could potentially be hampering growth. For example, the business has faced some headwinds.
Summary
On the whole, we feel that the performance shown by Y.Z. Queenco can be open to many interpretations. While the company does have a high rate of profit retention, its low rate of return is probably hampering its earnings growth. Wrapping up, we would proceed with caution with this company and one way of doing that would be to look at the risk profile of the business. Our risks dashboard would have the 3 risks we have identified for Y.Z. Queenco.
New: Manage All Your Stock Portfolios in One Place
We've created the ultimate portfolio companion for stock investors, and it's free.
• Connect an unlimited number of Portfolios and see your total in one currency
• Be alerted to new Warning Signs or Risks via email or mobile
• Track the Fair Value of your stocks
Have feedback on this article? Concerned about the content? Get in touch with us directly. Alternatively, email editorial-team (at) simplywallst.com.
This article by Simply Wall St is general in nature. We provide commentary based on historical data and analyst forecasts only using an unbiased methodology and our articles are not intended to be financial advice. It does not constitute a recommendation to buy or sell any stock, and does not take account of your objectives, or your financial situation. We aim to bring you long-term focused analysis driven by fundamental data. Note that our analysis may not factor in the latest price-sensitive company announcements or qualitative material. Simply Wall St has no position in any stocks mentioned.
About TASE:QNCO
Solid track record with excellent balance sheet.
