- Israel
- /
- Food and Staples Retail
- /
- TASE:YHNF
Insiders were the biggest winners as M.Yochananof and Sons (1988) Ltd's (TLV:YHNF) market cap grew by ₪185m last week


Key Insights
- Insiders appear to have a vested interest in M.Yochananof and Sons (1988)'s growth, as seen by their sizeable ownership
- A total of 3 investors have a majority stake in the company with 55% ownership
- Institutional ownership in M.Yochananof and Sons (1988) is 18%
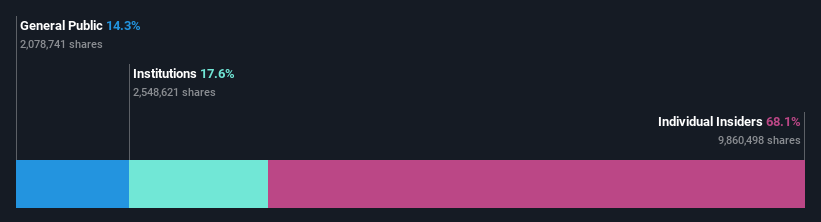
To get a sense of who is truly in control of M.Yochananof and Sons (1988) Ltd (TLV:YHNF), it is important to understand the ownership structure of the business. We can see that individual insiders own the lion's share in the company with 68% ownership. Put another way, the group faces the maximum upside potential (or downside risk).
Clearly, insiders benefitted the most after the company's market cap rose by ₪185m last week.
In the chart below, we zoom in on the different ownership groups of M.Yochananof and Sons (1988).
View our latest analysis for M.Yochananof and Sons (1988)
What Does The Institutional Ownership Tell Us About M.Yochananof and Sons (1988)?
Many institutions measure their performance against an index that approximates the local market. So they usually pay more attention to companies that are included in major indices.
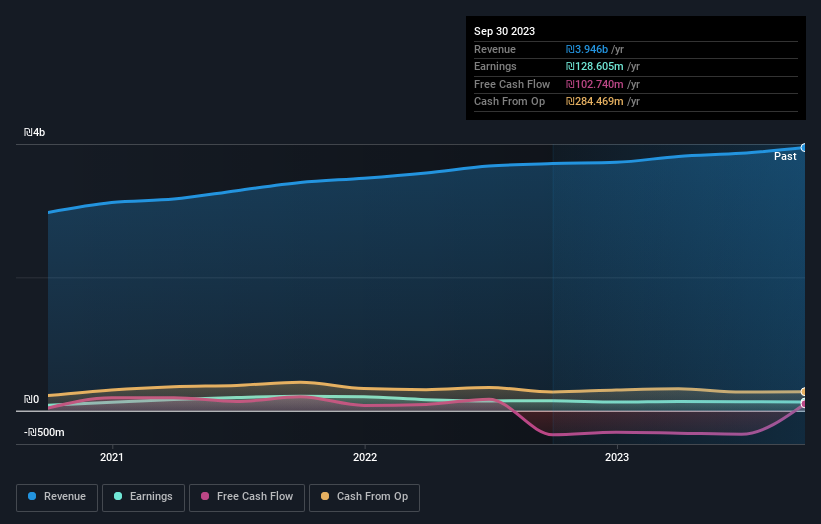
We can see that M.Yochananof and Sons (1988) does have institutional investors; and they hold a good portion of the company's stock. This implies the analysts working for those institutions have looked at the stock and they like it. But just like anyone else, they could be wrong. If multiple institutions change their view on a stock at the same time, you could see the share price drop fast. It's therefore worth looking at M.Yochananof and Sons (1988)'s earnings history below. Of course, the future is what really matters.
We note that hedge funds don't have a meaningful investment in M.Yochananof and Sons (1988). The company's largest shareholder is Mordechai Jochananov, with ownership of 26%. Meanwhile, the second and third largest shareholders, hold 16% and 13%, of the shares outstanding, respectively.
A more detailed study of the shareholder registry showed us that 3 of the top shareholders have a considerable amount of ownership in the company, via their 55% stake.
While studying institutional ownership for a company can add value to your research, it is also a good practice to research analyst recommendations to get a deeper understand of a stock's expected performance. We're not picking up on any analyst coverage of the stock at the moment, so the company is unlikely to be widely held.
Insider Ownership Of M.Yochananof and Sons (1988)
While the precise definition of an insider can be subjective, almost everyone considers board members to be insiders. Management ultimately answers to the board. However, it is not uncommon for managers to be executive board members, especially if they are a founder or the CEO.
I generally consider insider ownership to be a good thing. However, on some occasions it makes it more difficult for other shareholders to hold the board accountable for decisions.
Our information suggests that insiders own more than half of M.Yochananof and Sons (1988) Ltd. This gives them effective control of the company. That means they own ₪1.6b worth of shares in the ₪2.3b company. That's quite meaningful. It is good to see this level of investment. You can check here to see if those insiders have been buying recently.
General Public Ownership
The general public, who are usually individual investors, hold a 14% stake in M.Yochananof and Sons (1988). While this size of ownership may not be enough to sway a policy decision in their favour, they can still make a collective impact on company policies.
Next Steps:
While it is well worth considering the different groups that own a company, there are other factors that are even more important.
I like to dive deeper into how a company has performed in the past. You can access this interactive graph of past earnings, revenue and cash flow, for free.
Of course, you might find a fantastic investment by looking elsewhere. So take a peek at this free list of interesting companies.
NB: Figures in this article are calculated using data from the last twelve months, which refer to the 12-month period ending on the last date of the month the financial statement is dated. This may not be consistent with full year annual report figures.
New: Manage All Your Stock Portfolios in One Place
We've created the ultimate portfolio companion for stock investors, and it's free.
• Connect an unlimited number of Portfolios and see your total in one currency
• Be alerted to new Warning Signs or Risks via email or mobile
• Track the Fair Value of your stocks
Have feedback on this article? Concerned about the content? Get in touch with us directly. Alternatively, email editorial-team (at) simplywallst.com.
This article by Simply Wall St is general in nature. We provide commentary based on historical data and analyst forecasts only using an unbiased methodology and our articles are not intended to be financial advice. It does not constitute a recommendation to buy or sell any stock, and does not take account of your objectives, or your financial situation. We aim to bring you long-term focused analysis driven by fundamental data. Note that our analysis may not factor in the latest price-sensitive company announcements or qualitative material. Simply Wall St has no position in any stocks mentioned.
About TASE:YHNF
M.Yochananof and Sons (1988)
Engages in the marketing and retail trade in the food and related products in Israel.
Adequate balance sheet with acceptable track record.
