Stock Analysis
- Israel
- /
- Construction
- /
- TASE:ORON
Returns Are Gaining Momentum At Oron Group Investments & Holdings (TLV:ORON)

There are a few key trends to look for if we want to identify the next multi-bagger. In a perfect world, we'd like to see a company investing more capital into its business and ideally the returns earned from that capital are also increasing. Put simply, these types of businesses are compounding machines, meaning they are continually reinvesting their earnings at ever-higher rates of return. Speaking of which, we noticed some great changes in Oron Group Investments & Holdings' (TLV:ORON) returns on capital, so let's have a look.
Understanding Return On Capital Employed (ROCE)
If you haven't worked with ROCE before, it measures the 'return' (pre-tax profit) a company generates from capital employed in its business. Analysts use this formula to calculate it for Oron Group Investments & Holdings:
Return on Capital Employed = Earnings Before Interest and Tax (EBIT) ÷ (Total Assets - Current Liabilities)
0.19 = ₪66m ÷ (₪1.2b - ₪898m) (Based on the trailing twelve months to March 2023).
Thus, Oron Group Investments & Holdings has an ROCE of 19%. In absolute terms, that's a satisfactory return, but compared to the Construction industry average of 6.4% it's much better.
View our latest analysis for Oron Group Investments & Holdings
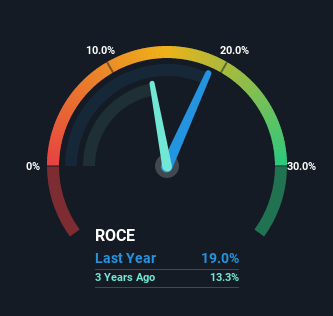
Historical performance is a great place to start when researching a stock so above you can see the gauge for Oron Group Investments & Holdings' ROCE against it's prior returns. If you're interested in investigating Oron Group Investments & Holdings' past further, check out this free graph of past earnings, revenue and cash flow.
SWOT Analysis for Oron Group Investments & Holdings
- Earnings growth over the past year exceeded the industry.
- Debt is well covered by cash flow.
- Dividends are covered by earnings and cash flows.
- Interest payments on debt are not well covered.
- Dividend is low compared to the top 25% of dividend payers in the Construction market.
- Trading below our estimate of fair value by more than 20%.
- Lack of analyst coverage makes it difficult to determine ORON's earnings prospects.
- No apparent threats visible for ORON.
How Are Returns Trending?
The fact that Oron Group Investments & Holdings is now generating some pre-tax profits from its prior investments is very encouraging. Shareholders would no doubt be pleased with this because the business was loss-making five years ago but is is now generating 19% on its capital. In addition to that, Oron Group Investments & Holdings is employing 23% more capital than previously which is expected of a company that's trying to break into profitability. This can tell us that the company has plenty of reinvestment opportunities that are able to generate higher returns.
On a side note, we noticed that the improvement in ROCE appears to be partly fueled by an increase in current liabilities. Essentially the business now has suppliers or short-term creditors funding about 72% of its operations, which isn't ideal. And with current liabilities at those levels, that's pretty high.
The Key Takeaway
To the delight of most shareholders, Oron Group Investments & Holdings has now broken into profitability. And with a respectable 59% awarded to those who held the stock over the last five years, you could argue that these developments are starting to get the attention they deserve. So given the stock has proven it has promising trends, it's worth researching the company further to see if these trends are likely to persist.
Oron Group Investments & Holdings does have some risks, we noticed 2 warning signs (and 1 which is a bit unpleasant) we think you should know about.
For those who like to invest in solid companies, check out this free list of companies with solid balance sheets and high returns on equity.
Valuation is complex, but we're helping make it simple.
Find out whether Oron Group Investments & Holdings is potentially over or undervalued by checking out our comprehensive analysis, which includes fair value estimates, risks and warnings, dividends, insider transactions and financial health.
View the Free AnalysisHave feedback on this article? Concerned about the content? Get in touch with us directly. Alternatively, email editorial-team (at) simplywallst.com.
This article by Simply Wall St is general in nature. We provide commentary based on historical data and analyst forecasts only using an unbiased methodology and our articles are not intended to be financial advice. It does not constitute a recommendation to buy or sell any stock, and does not take account of your objectives, or your financial situation. We aim to bring you long-term focused analysis driven by fundamental data. Note that our analysis may not factor in the latest price-sensitive company announcements or qualitative material. Simply Wall St has no position in any stocks mentioned.
About TASE:ORON
Oron Group Investments & Holdings
Oron Group Investments & Holdings Ltd, together with its subsidiaries, engages in the civil engineering, infrastructure, and construction businesses in Israel.
Questionable track record with imperfect balance sheet.

