
Advertisement
- Israel
- /
- Construction
- /
- TASE:ASHG
What Ashtrom Group Ltd.'s (TLV:ASHG) 29% Share Price Gain Is Not Telling You
Ashtrom Group Ltd. (TLV:ASHG) shares have had a really impressive month, gaining 29% after a shaky period beforehand. While recent buyers may be laughing, long-term holders might not be as pleased since the recent gain only brings the stock back to where it started a year ago.
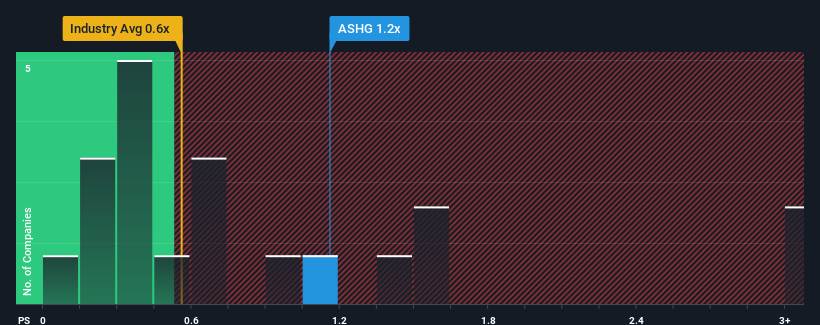
Following the firm bounce in price, given close to half the companies operating in Israel's Construction industry have price-to-sales ratios (or "P/S") below 0.6x, you may consider Ashtrom Group as a stock to potentially avoid with its 1.2x P/S ratio. Although, it's not wise to just take the P/S at face value as there may be an explanation why it's as high as it is.
View our latest analysis for Ashtrom Group
What Does Ashtrom Group's P/S Mean For Shareholders?
For instance, Ashtrom Group's receding revenue in recent times would have to be some food for thought. It might be that many expect the company to still outplay most other companies over the coming period, which has kept the P/S from collapsing. You'd really hope so, otherwise you're paying a pretty hefty price for no particular reason.
We don't have analyst forecasts, but you can see how recent trends are setting up the company for the future by checking out our free report on Ashtrom Group's earnings, revenue and cash flow.How Is Ashtrom Group's Revenue Growth Trending?
In order to justify its P/S ratio, Ashtrom Group would need to produce impressive growth in excess of the industry.
Taking a look back first, the company's revenue growth last year wasn't something to get excited about as it posted a disappointing decline of 9.6%. Unfortunately, that's brought it right back to where it started three years ago with revenue growth being virtually non-existent overall during that time. Accordingly, shareholders probably wouldn't have been overly satisfied with the unstable medium-term growth rates.
This is in contrast to the rest of the industry, which is expected to grow by 13% over the next year, materially higher than the company's recent medium-term annualised growth rates.
With this in mind, we find it worrying that Ashtrom Group's P/S exceeds that of its industry peers. Apparently many investors in the company are way more bullish than recent times would indicate and aren't willing to let go of their stock at any price. Only the boldest would assume these prices are sustainable as a continuation of recent revenue trends is likely to weigh heavily on the share price eventually.
The Final Word
Ashtrom Group's P/S is on the rise since its shares have risen strongly. While the price-to-sales ratio shouldn't be the defining factor in whether you buy a stock or not, it's quite a capable barometer of revenue expectations.
Our examination of Ashtrom Group revealed its poor three-year revenue trends aren't detracting from the P/S as much as we though, given they look worse than current industry expectations. When we see slower than industry revenue growth but an elevated P/S, there's considerable risk of the share price declining, sending the P/S lower. Unless there is a significant improvement in the company's medium-term performance, it will be difficult to prevent the P/S ratio from declining to a more reasonable level.
There are also other vital risk factors to consider and we've discovered 2 warning signs for Ashtrom Group (1 is a bit concerning!) that you should be aware of before investing here.
It's important to make sure you look for a great company, not just the first idea you come across. So if growing profitability aligns with your idea of a great company, take a peek at this free list of interesting companies with strong recent earnings growth (and a low P/E).
New: Manage All Your Stock Portfolios in One Place
We've created the ultimate portfolio companion for stock investors, and it's free.
• Connect an unlimited number of Portfolios and see your total in one currency
• Be alerted to new Warning Signs or Risks via email or mobile
• Track the Fair Value of your stocks
Have feedback on this article? Concerned about the content? Get in touch with us directly. Alternatively, email editorial-team (at) simplywallst.com.
This article by Simply Wall St is general in nature. We provide commentary based on historical data and analyst forecasts only using an unbiased methodology and our articles are not intended to be financial advice. It does not constitute a recommendation to buy or sell any stock, and does not take account of your objectives, or your financial situation. We aim to bring you long-term focused analysis driven by fundamental data. Note that our analysis may not factor in the latest price-sensitive company announcements or qualitative material. Simply Wall St has no position in any stocks mentioned.
Have feedback on this article? Concerned about the content? Get in touch with us directly. Alternatively, email editorial-team@simplywallst.com
About TASE:ASHG
Ashtrom Group
Operates as a construction and property company in Israel and internationally.
Slight risk and overvalued.
Similar Companies
Market Insights

Advertisement
Community Narratives
The company that turned a verb into a global necessity and basically runs the modern internet, digital ads, smartphones, maps, and AI.
Fair Value US$300.00|7.1% undervalued
OS
Community Contributor
Flowers Foods Pays A Fair Price For Health
Fair Value US$16.12|26.4% undervalued
NV
Community Contributor
TMX Group will thrive with 33.3% profit margin and enduring market moat
Fair Value CA$49.90|0.8% overvalued
LI
Community Contributor
The "Molecular Pencil": Why Beam's Technology is Built to Win
Fair Value US$65.01|65.8% undervalued
DA
Community Contributor