Stock Analysis
Glanbia's (ISE:GL9) investors will be pleased with their decent 34% return over the last year


If you want to compound wealth in the stock market, you can do so by buying an index fund. But investors can boost returns by picking market-beating companies to own shares in. To wit, the Glanbia plc (ISE:GL9) share price is 31% higher than it was a year ago, much better than the market return of around 13% (not including dividends) in the same period. If it can keep that out-performance up over the long term, investors will do very well! Looking back further, the share price is 28% higher than it was three years ago.
So let's investigate and see if the longer term performance of the company has been in line with the underlying business' progress.
View our latest analysis for Glanbia
While the efficient markets hypothesis continues to be taught by some, it has been proven that markets are over-reactive dynamic systems, and investors are not always rational. One imperfect but simple way to consider how the market perception of a company has shifted is to compare the change in the earnings per share (EPS) with the share price movement.
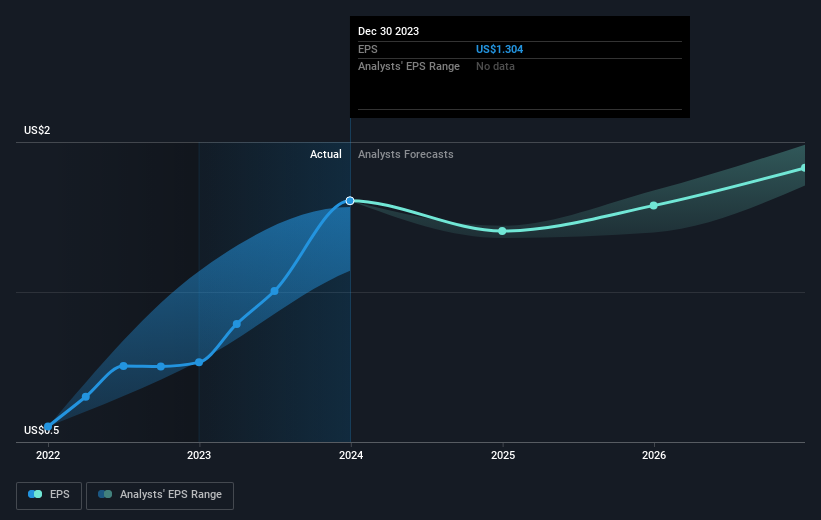
Glanbia was able to grow EPS by 70% in the last twelve months. This EPS growth is significantly higher than the 31% increase in the share price. So it seems like the market has cooled on Glanbia, despite the growth. Interesting.
You can see below how EPS has changed over time (discover the exact values by clicking on the image).
It's good to see that there was some significant insider buying in the last three months. That's a positive. That said, we think earnings and revenue growth trends are even more important factors to consider. This free interactive report on Glanbia's earnings, revenue and cash flow is a great place to start, if you want to investigate the stock further.
What About Dividends?
As well as measuring the share price return, investors should also consider the total shareholder return (TSR). Whereas the share price return only reflects the change in the share price, the TSR includes the value of dividends (assuming they were reinvested) and the benefit of any discounted capital raising or spin-off. Arguably, the TSR gives a more comprehensive picture of the return generated by a stock. In the case of Glanbia, it has a TSR of 34% for the last 1 year. That exceeds its share price return that we previously mentioned. The dividends paid by the company have thusly boosted the total shareholder return.
A Different Perspective
It's good to see that Glanbia has rewarded shareholders with a total shareholder return of 34% in the last twelve months. And that does include the dividend. That's better than the annualised return of 5% over half a decade, implying that the company is doing better recently. Someone with an optimistic perspective could view the recent improvement in TSR as indicating that the business itself is getting better with time. It's always interesting to track share price performance over the longer term. But to understand Glanbia better, we need to consider many other factors. For example, we've discovered 1 warning sign for Glanbia that you should be aware of before investing here.
Glanbia is not the only stock that insiders are buying. For those who like to find lesser know companies this free list of growing companies with recent insider purchasing, could be just the ticket.
Please note, the market returns quoted in this article reflect the market weighted average returns of stocks that currently trade on Irish exchanges.
Valuation is complex, but we're helping make it simple.
Find out whether Glanbia is potentially over or undervalued by checking out our comprehensive analysis, which includes fair value estimates, risks and warnings, dividends, insider transactions and financial health.
View the Free AnalysisHave feedback on this article? Concerned about the content? Get in touch with us directly. Alternatively, email editorial-team (at) simplywallst.com.
This article by Simply Wall St is general in nature. We provide commentary based on historical data and analyst forecasts only using an unbiased methodology and our articles are not intended to be financial advice. It does not constitute a recommendation to buy or sell any stock, and does not take account of your objectives, or your financial situation. We aim to bring you long-term focused analysis driven by fundamental data. Note that our analysis may not factor in the latest price-sensitive company announcements or qualitative material. Simply Wall St has no position in any stocks mentioned.
About ISE:GL9
Flawless balance sheet with solid track record.

