- Hong Kong
- /
- Electric Utilities
- /
- SEHK:1713
Sichuan Energy Investment Development (HKG:1713) jumps 12% this week, though earnings growth is still tracking behind one-year shareholder returns


The simplest way to invest in stocks is to buy exchange traded funds. But one can do better than that by picking better than average stocks (as part of a diversified portfolio). For example, the Sichuan Energy Investment Development Co., Ltd. (HKG:1713) share price is up 39% in the last 1 year, clearly besting the market return of around 5.6% (not including dividends). If it can keep that out-performance up over the long term, investors will do very well! The longer term returns have not been as good, with the stock price only 29% higher than it was three years ago.
Since it's been a strong week for Sichuan Energy Investment Development shareholders, let's have a look at trend of the longer term fundamentals.
See our latest analysis for Sichuan Energy Investment Development
While markets are a powerful pricing mechanism, share prices reflect investor sentiment, not just underlying business performance. One flawed but reasonable way to assess how sentiment around a company has changed is to compare the earnings per share (EPS) with the share price.
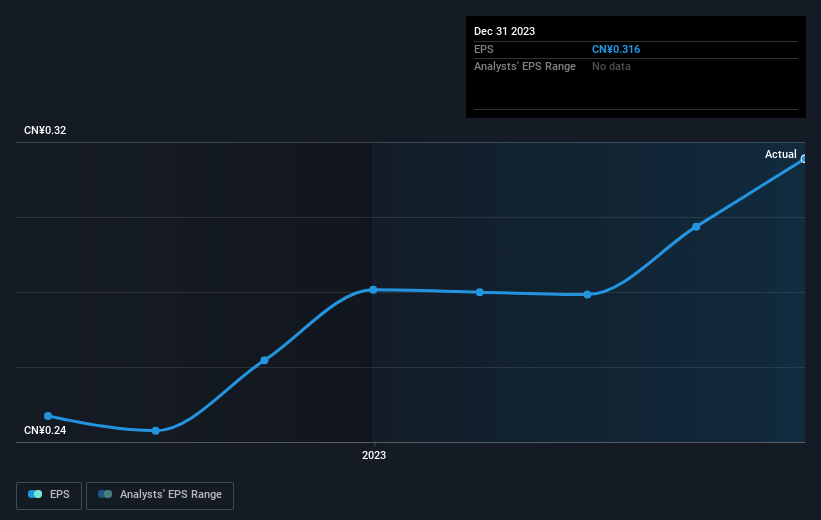
Sichuan Energy Investment Development was able to grow EPS by 12% in the last twelve months. The share price gain of 39% certainly outpaced the EPS growth. This indicates that the market is now more optimistic about the stock.
The image below shows how EPS has tracked over time (if you click on the image you can see greater detail).
Before buying or selling a stock, we always recommend a close examination of historic growth trends, available here.
What About Dividends?
It is important to consider the total shareholder return, as well as the share price return, for any given stock. Whereas the share price return only reflects the change in the share price, the TSR includes the value of dividends (assuming they were reinvested) and the benefit of any discounted capital raising or spin-off. So for companies that pay a generous dividend, the TSR is often a lot higher than the share price return. We note that for Sichuan Energy Investment Development the TSR over the last 1 year was 51%, which is better than the share price return mentioned above. And there's no prize for guessing that the dividend payments largely explain the divergence!
A Different Perspective
It's good to see that Sichuan Energy Investment Development has rewarded shareholders with a total shareholder return of 51% in the last twelve months. And that does include the dividend. That's better than the annualised return of 13% over half a decade, implying that the company is doing better recently. In the best case scenario, this may hint at some real business momentum, implying that now could be a great time to delve deeper. While it is well worth considering the different impacts that market conditions can have on the share price, there are other factors that are even more important. Take risks, for example - Sichuan Energy Investment Development has 2 warning signs (and 1 which is concerning) we think you should know about.
Of course, you might find a fantastic investment by looking elsewhere. So take a peek at this free list of companies we expect will grow earnings.
Please note, the market returns quoted in this article reflect the market weighted average returns of stocks that currently trade on Hong Kong exchanges.
New: Manage All Your Stock Portfolios in One Place
We've created the ultimate portfolio companion for stock investors, and it's free.
• Connect an unlimited number of Portfolios and see your total in one currency
• Be alerted to new Warning Signs or Risks via email or mobile
• Track the Fair Value of your stocks
Have feedback on this article? Concerned about the content? Get in touch with us directly. Alternatively, email editorial-team (at) simplywallst.com.
This article by Simply Wall St is general in nature. We provide commentary based on historical data and analyst forecasts only using an unbiased methodology and our articles are not intended to be financial advice. It does not constitute a recommendation to buy or sell any stock, and does not take account of your objectives, or your financial situation. We aim to bring you long-term focused analysis driven by fundamental data. Note that our analysis may not factor in the latest price-sensitive company announcements or qualitative material. Simply Wall St has no position in any stocks mentioned.
About SEHK:1713
Sichuan Energy Investment Development
A vertically integrated power supplier and service provider, generates, distributes, and sells electricity primarily in Mainland China.
Excellent balance sheet and good value.
