- Hong Kong
- /
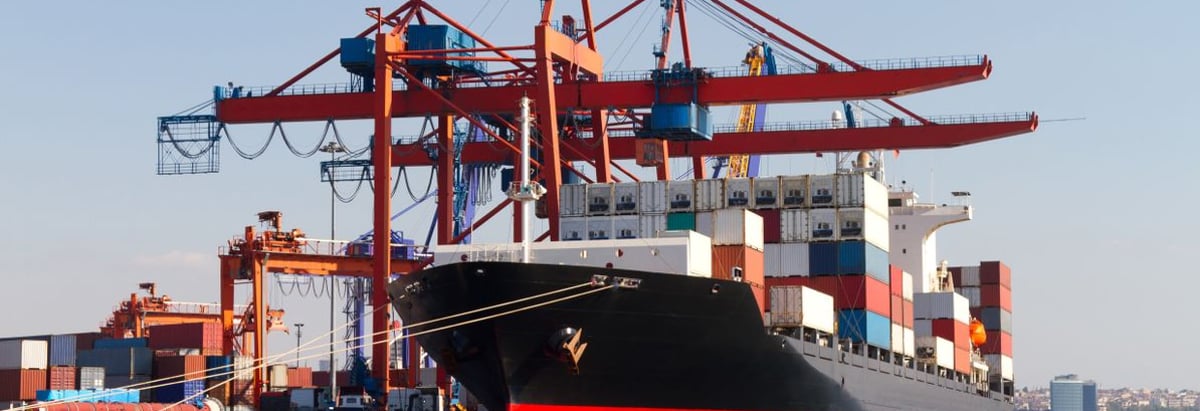
- Marine and Shipping
- /
- SEHK:137
Jinhui Holdings (HKG:137) three-year losses have grown faster than shareholder returns have fallen, but the stock swells 14% this past week

It's nice to see the Jinhui Holdings Company Limited (HKG:137) share price up 14% in a week. But that doesn't help the fact that the three year return is less impressive. Truth be told the share price declined 34% in three years and that return, Dear Reader, falls short of what you could have got from passive investing with an index fund.
On a more encouraging note the company has added HK$48m to its market cap in just the last 7 days, so let's see if we can determine what's driven the three-year loss for shareholders.
See our latest analysis for Jinhui Holdings
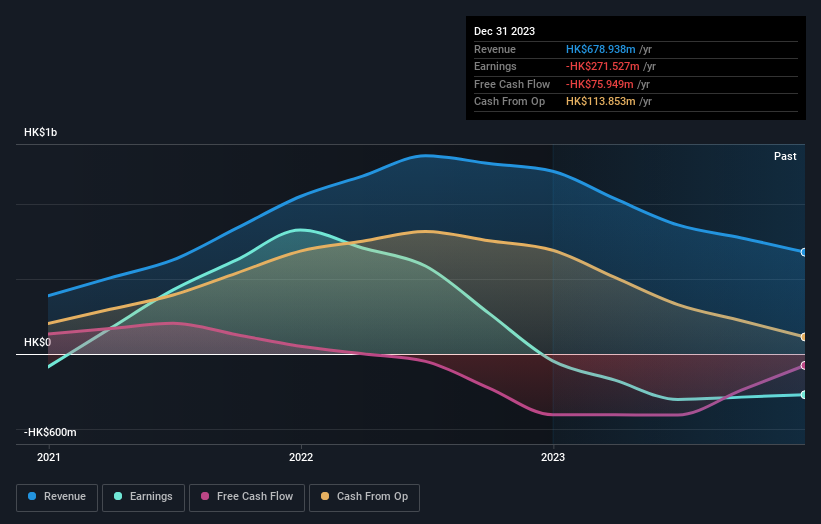
Jinhui Holdings wasn't profitable in the last twelve months, it is unlikely we'll see a strong correlation between its share price and its earnings per share (EPS). Arguably revenue is our next best option. Generally speaking, companies without profits are expected to grow revenue every year, and at a good clip. That's because fast revenue growth can be easily extrapolated to forecast profits, often of considerable size.
Over three years, Jinhui Holdings grew revenue at 12% per year. That's a pretty good rate of top-line growth. Shareholders have seen the share price fall at 10% per year, for three years. So the market has definitely lost some love for the stock. However, that's in the past now, and it's the future is more important - and the future looks brighter (based on revenue, anyway).
The image below shows how earnings and revenue have tracked over time (if you click on the image you can see greater detail).
This free interactive report on Jinhui Holdings' balance sheet strength is a great place to start, if you want to investigate the stock further.
What About The Total Shareholder Return (TSR)?
We've already covered Jinhui Holdings' share price action, but we should also mention its total shareholder return (TSR). The TSR is a return calculation that accounts for the value of cash dividends (assuming that any dividend received was reinvested) and the calculated value of any discounted capital raisings and spin-offs. Its history of dividend payouts mean that Jinhui Holdings' TSR, which was a 29% drop over the last 3 years, was not as bad as the share price return.
A Different Perspective
Jinhui Holdings shareholders are down 7.4% for the year, but the market itself is up 10.0%. However, keep in mind that even the best stocks will sometimes underperform the market over a twelve month period. Unfortunately, last year's performance may indicate unresolved challenges, given that it was worse than the annualised loss of 2% over the last half decade. We realise that Baron Rothschild has said investors should "buy when there is blood on the streets", but we caution that investors should first be sure they are buying a high quality business. It's always interesting to track share price performance over the longer term. But to understand Jinhui Holdings better, we need to consider many other factors. Take risks, for example - Jinhui Holdings has 3 warning signs (and 2 which are concerning) we think you should know about.
Of course Jinhui Holdings may not be the best stock to buy. So you may wish to see this free collection of growth stocks.
Please note, the market returns quoted in this article reflect the market weighted average returns of stocks that currently trade on Hong Kong exchanges.
New: Manage All Your Stock Portfolios in One Place
We've created the ultimate portfolio companion for stock investors, and it's free.
• Connect an unlimited number of Portfolios and see your total in one currency
• Be alerted to new Warning Signs or Risks via email or mobile
• Track the Fair Value of your stocks
Have feedback on this article? Concerned about the content? Get in touch with us directly. Alternatively, email editorial-team (at) simplywallst.com.
This article by Simply Wall St is general in nature. We provide commentary based on historical data and analyst forecasts only using an unbiased methodology and our articles are not intended to be financial advice. It does not constitute a recommendation to buy or sell any stock, and does not take account of your objectives, or your financial situation. We aim to bring you long-term focused analysis driven by fundamental data. Note that our analysis may not factor in the latest price-sensitive company announcements or qualitative material. Simply Wall St has no position in any stocks mentioned.
About SEHK:137
Jinhui Holdings
An investment holding company, engages in ship chartering and owning activities worldwide.
Excellent balance sheet low.
