- Hong Kong
- /
- Infrastructure
- /
- SEHK:107
Investors three-year returns in Sichuan Expressway (HKG:107) have not grown faster than the company's underlying earnings growth


By buying an index fund, investors can approximate the average market return. But if you choose individual stocks with prowess, you can make superior returns. For example, the Sichuan Expressway Company Limited (HKG:107) share price is up 28% in the last three years, clearly besting the market decline of around 40% (not including dividends).
While this past week has detracted from the company's three-year return, let's look at the recent trends of the underlying business and see if the gains have been in alignment.
See our latest analysis for Sichuan Expressway
There is no denying that markets are sometimes efficient, but prices do not always reflect underlying business performance. One flawed but reasonable way to assess how sentiment around a company has changed is to compare the earnings per share (EPS) with the share price.
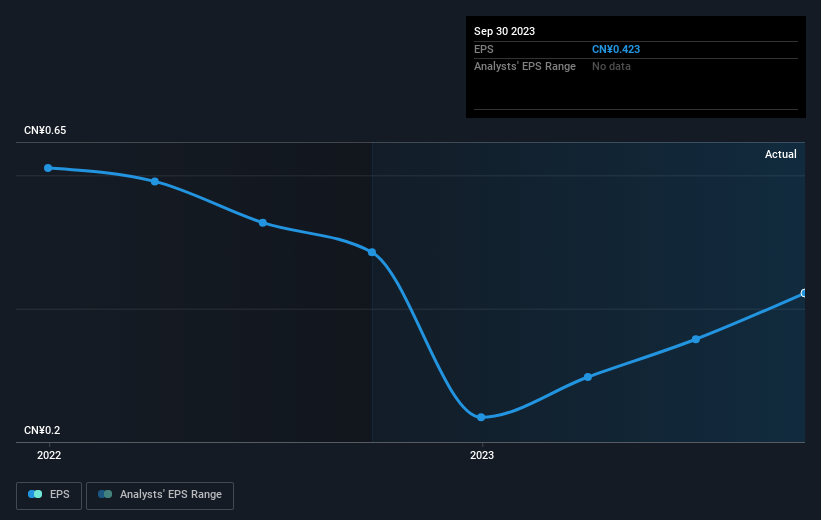
During three years of share price growth, Sichuan Expressway achieved compound earnings per share growth of 78% per year. This EPS growth is higher than the 9% average annual increase in the share price. So it seems investors have become more cautious about the company, over time. We'd venture the lowish P/E ratio of 5.11 also reflects the negative sentiment around the stock.
The image below shows how EPS has tracked over time (if you click on the image you can see greater detail).
Dive deeper into Sichuan Expressway's key metrics by checking this interactive graph of Sichuan Expressway's earnings, revenue and cash flow.
What About Dividends?
When looking at investment returns, it is important to consider the difference between total shareholder return (TSR) and share price return. The TSR is a return calculation that accounts for the value of cash dividends (assuming that any dividend received was reinvested) and the calculated value of any discounted capital raisings and spin-offs. It's fair to say that the TSR gives a more complete picture for stocks that pay a dividend. We note that for Sichuan Expressway the TSR over the last 3 years was 52%, which is better than the share price return mentioned above. And there's no prize for guessing that the dividend payments largely explain the divergence!
A Different Perspective
It's good to see that Sichuan Expressway has rewarded shareholders with a total shareholder return of 30% in the last twelve months. And that does include the dividend. That gain is better than the annual TSR over five years, which is 4%. Therefore it seems like sentiment around the company has been positive lately. Someone with an optimistic perspective could view the recent improvement in TSR as indicating that the business itself is getting better with time. I find it very interesting to look at share price over the long term as a proxy for business performance. But to truly gain insight, we need to consider other information, too. Case in point: We've spotted 2 warning signs for Sichuan Expressway you should be aware of, and 1 of them is concerning.
If you would prefer to check out another company -- one with potentially superior financials -- then do not miss this free list of companies that have proven they can grow earnings.
Please note, the market returns quoted in this article reflect the market weighted average returns of stocks that currently trade on Hong Kong exchanges.
New: Manage All Your Stock Portfolios in One Place
We've created the ultimate portfolio companion for stock investors, and it's free.
• Connect an unlimited number of Portfolios and see your total in one currency
• Be alerted to new Warning Signs or Risks via email or mobile
• Track the Fair Value of your stocks
Have feedback on this article? Concerned about the content? Get in touch with us directly. Alternatively, email editorial-team (at) simplywallst.com.
This article by Simply Wall St is general in nature. We provide commentary based on historical data and analyst forecasts only using an unbiased methodology and our articles are not intended to be financial advice. It does not constitute a recommendation to buy or sell any stock, and does not take account of your objectives, or your financial situation. We aim to bring you long-term focused analysis driven by fundamental data. Note that our analysis may not factor in the latest price-sensitive company announcements or qualitative material. Simply Wall St has no position in any stocks mentioned.
About SEHK:107
Sichuan Expressway
Engages in the investment, construction, operation, and management of expressway infrastructure projects in Sichuan Province, the People’s Republic of China.
Solid track record average dividend payer.
