- Hong Kong
- /
- Infrastructure
- /
- SEHK:107
Despite the downward trend in earnings at Sichuan Expressway (HKG:107) the stock ascends 4.6%, bringing three-year gains to 119%


While Sichuan Expressway Company Limited (HKG:107) shareholders are probably generally happy, the stock hasn't had particularly good run recently, with the share price falling 11% in the last quarter. But don't let that distract from the very nice return generated over three years. To wit, the share price did better than an index fund, climbing 81% during that period.
On the back of a solid 7-day performance, let's check what role the company's fundamentals have played in driving long term shareholder returns.
View our latest analysis for Sichuan Expressway
While the efficient markets hypothesis continues to be taught by some, it has been proven that markets are over-reactive dynamic systems, and investors are not always rational. One way to examine how market sentiment has changed over time is to look at the interaction between a company's share price and its earnings per share (EPS).
During the three years of share price growth, Sichuan Expressway actually saw its earnings per share (EPS) drop 3.6% per year.
Based on these numbers, we think that the decline in earnings per share may not be a good representation of how the business has changed over the years. Since the change in EPS doesn't seem to correlate with the change in share price, it's worth taking a look at other metrics.
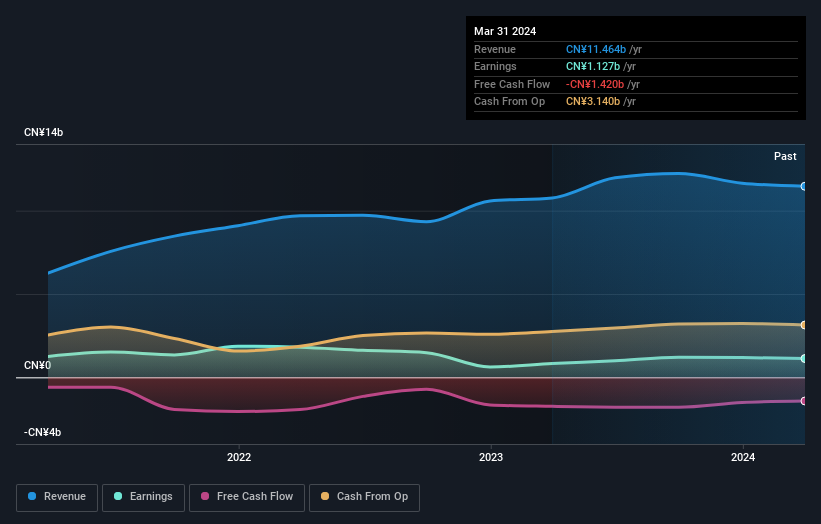
We note that the dividend is higher than it was preciously, so that may have assisted the share price. Sometimes yield-chasing investors will flock to a company if they think the dividend can grow over time. On top of that, revenue grew at a rate of 17% per year, and it's likely investors interpret that as pointing to a brighter future.
You can see below how earnings and revenue have changed over time (discover the exact values by clicking on the image).
Take a more thorough look at Sichuan Expressway's financial health with this free report on its balance sheet.
What About Dividends?
When looking at investment returns, it is important to consider the difference between total shareholder return (TSR) and share price return. The TSR incorporates the value of any spin-offs or discounted capital raisings, along with any dividends, based on the assumption that the dividends are reinvested. Arguably, the TSR gives a more comprehensive picture of the return generated by a stock. In the case of Sichuan Expressway, it has a TSR of 119% for the last 3 years. That exceeds its share price return that we previously mentioned. The dividends paid by the company have thusly boosted the total shareholder return.
A Different Perspective
We're pleased to report that Sichuan Expressway shareholders have received a total shareholder return of 36% over one year. Of course, that includes the dividend. That's better than the annualised return of 14% over half a decade, implying that the company is doing better recently. Someone with an optimistic perspective could view the recent improvement in TSR as indicating that the business itself is getting better with time. While it is well worth considering the different impacts that market conditions can have on the share price, there are other factors that are even more important. For instance, we've identified 2 warning signs for Sichuan Expressway (1 can't be ignored) that you should be aware of.
But note: Sichuan Expressway may not be the best stock to buy. So take a peek at this free list of interesting companies with past earnings growth (and further growth forecast).
Please note, the market returns quoted in this article reflect the market weighted average returns of stocks that currently trade on Hong Kong exchanges.
New: Manage All Your Stock Portfolios in One Place
We've created the ultimate portfolio companion for stock investors, and it's free.
• Connect an unlimited number of Portfolios and see your total in one currency
• Be alerted to new Warning Signs or Risks via email or mobile
• Track the Fair Value of your stocks
Have feedback on this article? Concerned about the content? Get in touch with us directly. Alternatively, email editorial-team (at) simplywallst.com.
This article by Simply Wall St is general in nature. We provide commentary based on historical data and analyst forecasts only using an unbiased methodology and our articles are not intended to be financial advice. It does not constitute a recommendation to buy or sell any stock, and does not take account of your objectives, or your financial situation. We aim to bring you long-term focused analysis driven by fundamental data. Note that our analysis may not factor in the latest price-sensitive company announcements or qualitative material. Simply Wall St has no position in any stocks mentioned.
About SEHK:107
Sichuan Expressway
Engages in the investment, construction, operation, and management of expressway infrastructure projects in Sichuan Province, the People’s Republic of China.
Solid track record average dividend payer.

