
Advertisement
- Hong Kong
- /
- Electronic Equipment and Components
- /
- SEHK:8070
The Return Trends At Keen Ocean International Holding (HKG:8070) Look Promising
If we want to find a potential multi-bagger, often there are underlying trends that can provide clues. Amongst other things, we'll want to see two things; firstly, a growing return on capital employed (ROCE) and secondly, an expansion in the company's amount of capital employed. This shows us that it's a compounding machine, able to continually reinvest its earnings back into the business and generate higher returns. So on that note, Keen Ocean International Holding (HKG:8070) looks quite promising in regards to its trends of return on capital.
Understanding Return On Capital Employed (ROCE)
If you haven't worked with ROCE before, it measures the 'return' (pre-tax profit) a company generates from capital employed in its business. The formula for this calculation on Keen Ocean International Holding is:
Return on Capital Employed = Earnings Before Interest and Tax (EBIT) ÷ (Total Assets - Current Liabilities)
0.17 = HK$17m ÷ (HK$210m - HK$112m) (Based on the trailing twelve months to December 2023).
So, Keen Ocean International Holding has an ROCE of 17%. In absolute terms, that's a satisfactory return, but compared to the Electronic industry average of 7.5% it's much better.
View our latest analysis for Keen Ocean International Holding
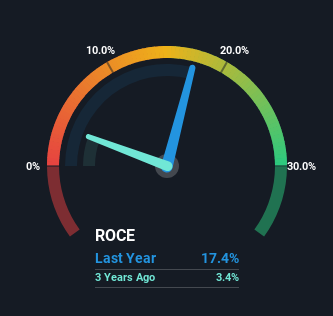
Historical performance is a great place to start when researching a stock so above you can see the gauge for Keen Ocean International Holding's ROCE against it's prior returns. If you'd like to look at how Keen Ocean International Holding has performed in the past in other metrics, you can view this free graph of Keen Ocean International Holding's past earnings, revenue and cash flow.
The Trend Of ROCE
We're delighted to see that Keen Ocean International Holding is reaping rewards from its investments and is now generating some pre-tax profits. The company was generating losses five years ago, but now it's earning 17% which is a sight for sore eyes. In addition to that, Keen Ocean International Holding is employing 74% more capital than previously which is expected of a company that's trying to break into profitability. This can tell us that the company has plenty of reinvestment opportunities that are able to generate higher returns.
Another thing to note, Keen Ocean International Holding has a high ratio of current liabilities to total assets of 53%. This effectively means that suppliers (or short-term creditors) are funding a large portion of the business, so just be aware that this can introduce some elements of risk. While it's not necessarily a bad thing, it can be beneficial if this ratio is lower.
The Key Takeaway
Long story short, we're delighted to see that Keen Ocean International Holding's reinvestment activities have paid off and the company is now profitable. Astute investors may have an opportunity here because the stock has declined 17% in the last five years. That being the case, research into the company's current valuation metrics and future prospects seems fitting.
On a separate note, we've found 1 warning sign for Keen Ocean International Holding you'll probably want to know about.
While Keen Ocean International Holding isn't earning the highest return, check out this free list of companies that are earning high returns on equity with solid balance sheets.
Valuation is complex, but we're here to simplify it.
Discover if Keen Ocean International Holding might be undervalued or overvalued with our detailed analysis, featuring fair value estimates, potential risks, dividends, insider trades, and its financial condition.
Access Free AnalysisHave feedback on this article? Concerned about the content? Get in touch with us directly. Alternatively, email editorial-team (at) simplywallst.com.
This article by Simply Wall St is general in nature. We provide commentary based on historical data and analyst forecasts only using an unbiased methodology and our articles are not intended to be financial advice. It does not constitute a recommendation to buy or sell any stock, and does not take account of your objectives, or your financial situation. We aim to bring you long-term focused analysis driven by fundamental data. Note that our analysis may not factor in the latest price-sensitive company announcements or qualitative material. Simply Wall St has no position in any stocks mentioned.
About SEHK:8070
Keen Ocean International Holding
An investment holding company, designs, develops, manufactures, and sells transformers, switching mode power supplies, electronic parts and components, and electric healthcare products in Hong Kong and internationally.
Flawless balance sheet and fair value.
Market Insights

Advertisement
Weekly Picks
RO


RockeTeller on Santacruz Silver Mining ·
Crazy Undervalued 42 Baggers Silver Play (Active & Running Mine)
Fair Value:CA$8696.7% undervalued
50 followersusers have followed this narrative
6 commentsusers have commented on this narrative
16 likesusers have liked this narrative
RO


Robbo on Fiducian Group ·
Fiducian: Compliance Clouds or Value Opportunity?
Fair Value:AU$122.0% undervalued
7 followersusers have followed this narrative
0 commentsusers have commented on this narrative
0 likesusers have liked this narrative
WO

woodworthfund on Willamette Valley Vineyards ·
Willamette Valley Vineyards (WVVI): Not-So-Great Value
Fair Value:US$247.5% overvalued
10 followersusers have followed this narrative
0 commentsusers have commented on this narrative
1 likeusers have liked this narrative
Recently Updated Narratives
IN

IncomeAssets on Pulse Seismic ·
Watch Pulse Seismic Outperform with 13.6% Revenue Growth in the Coming Years
Fair Value:CA$4.4729.5% undervalued
3 followersusers have followed this narrative
0 commentsusers have commented on this narrative
0 likesusers have liked this narrative
VL

Vladislav on Galleon Gold ·
Significantly undervalued gold explorer in Timmins, finally getting traction
Fair Value:CA$482.8% undervalued
6 followersusers have followed this narrative
0 commentsusers have commented on this narrative
0 likesusers have liked this narrative
FU

FundamentallySarcastic on Credit Corp Group ·
Moderation and Stabilisation: HOLD: Fair Price based on a 4-year Cycle is $12.08
Fair Value:AU$12.6410.8% overvalued
6 followersusers have followed this narrative
0 commentsusers have commented on this narrative
0 likesusers have liked this narrative
Popular Narratives
TH


TheWallstreetKing on MicroVision ·
MicroVision will explode future revenue by 380.37% with a vision towards success
Fair Value:US$6098.5% undervalued
116 followersusers have followed this narrative
11 commentsusers have commented on this narrative
22 likesusers have liked this narrative
AN


AnalystConsensusTarget on NVIDIA ·
NVDA: Expanding AI Demand Will Drive Major Data Center Investments Through 2026
Fair Value:US$250.3926.8% undervalued
957 followersusers have followed this narrative
6 commentsusers have commented on this narrative
25 likesusers have liked this narrative
AN

AnalystConsensusTarget on Alphabet ·
GOOGL: AI Platform Expansion And Cloud Demand Will Support Durable Performance Amid Competitive Pressures
Fair Value:US$323.71.9% undervalued
1341 followersusers have followed this narrative
0 commentsusers have commented on this narrative
17 likesusers have liked this narrative

