Strong week for K & P International Holdings (HKG:675) shareholders doesn't alleviate pain of three-year loss
This week we saw the K & P International Holdings Limited (HKG:675) share price climb by 11%. But that doesn't help the fact that the three year return is less impressive. After all, the share price is down 55% in the last three years, significantly under-performing the market.
On a more encouraging note the company has added HK$11m to its market cap in just the last 7 days, so let's see if we can determine what's driven the three-year loss for shareholders.
View our latest analysis for K & P International Holdings
K & P International Holdings isn't currently profitable, so most analysts would look to revenue growth to get an idea of how fast the underlying business is growing. Generally speaking, companies without profits are expected to grow revenue every year, and at a good clip. That's because it's hard to be confident a company will be sustainable if revenue growth is negligible, and it never makes a profit.
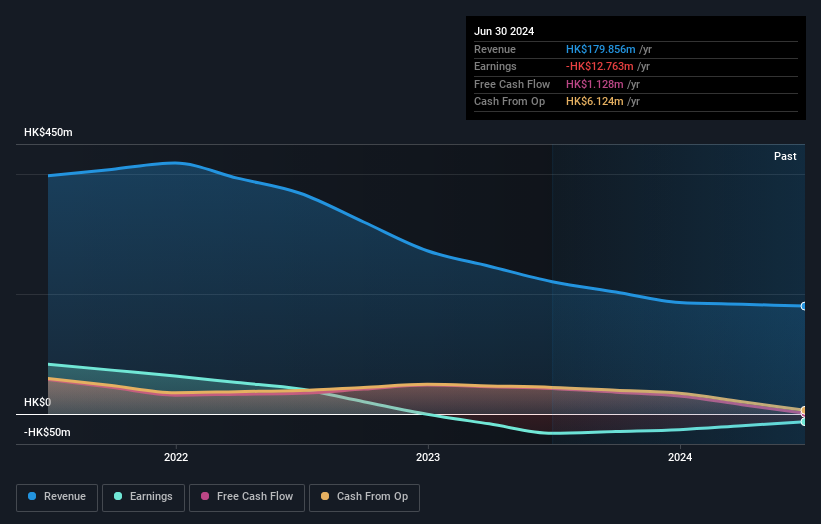
Over the last three years, K & P International Holdings' revenue dropped 32% per year. That means its revenue trend is very weak compared to other loss making companies. With no profits and falling revenue it is no surprise that investors have been dumping the stock, pushing the price down by 16% per year over that time. Bagholders or 'baggies' are people who buy more of a stock as the price collapses. They are then left 'holding the bag' if the shares turn out to be worthless. It could be a while before the company repays long suffering shareholders with share price gains.
You can see below how earnings and revenue have changed over time (discover the exact values by clicking on the image).

Balance sheet strength is crucial. It might be well worthwhile taking a look at our free report on how its financial position has changed over time.
What About Dividends?
It is important to consider the total shareholder return, as well as the share price return, for any given stock. The TSR is a return calculation that accounts for the value of cash dividends (assuming that any dividend received was reinvested) and the calculated value of any discounted capital raisings and spin-offs. So for companies that pay a generous dividend, the TSR is often a lot higher than the share price return. As it happens, K & P International Holdings' TSR for the last 3 years was -21%, which exceeds the share price return mentioned earlier. The dividends paid by the company have thusly boosted the total shareholder return.
A Different Perspective
It's good to see that K & P International Holdings has rewarded shareholders with a total shareholder return of 34% in the last twelve months. And that does include the dividend. That's better than the annualised return of 12% over half a decade, implying that the company is doing better recently. Someone with an optimistic perspective could view the recent improvement in TSR as indicating that the business itself is getting better with time. It's always interesting to track share price performance over the longer term. But to understand K & P International Holdings better, we need to consider many other factors. For instance, we've identified 3 warning signs for K & P International Holdings (2 don't sit too well with us) that you should be aware of.
Of course K & P International Holdings may not be the best stock to buy. So you may wish to see this free collection of growth stocks.
Please note, the market returns quoted in this article reflect the market weighted average returns of stocks that currently trade on Hong Kong exchanges.
Valuation is complex, but we're here to simplify it.
Discover if K & P International Holdings might be undervalued or overvalued with our detailed analysis, featuring fair value estimates, potential risks, dividends, insider trades, and its financial condition.
Access Free AnalysisHave feedback on this article? Concerned about the content? Get in touch with us directly. Alternatively, email editorial-team (at) simplywallst.com.
This article by Simply Wall St is general in nature. We provide commentary based on historical data and analyst forecasts only using an unbiased methodology and our articles are not intended to be financial advice. It does not constitute a recommendation to buy or sell any stock, and does not take account of your objectives, or your financial situation. We aim to bring you long-term focused analysis driven by fundamental data. Note that our analysis may not factor in the latest price-sensitive company announcements or qualitative material. Simply Wall St has no position in any stocks mentioned.
About SEHK:675
K & P International Holdings
An investment holding company, manufactures and sells precision parts and components in Hong Kong, Mainland China, Japan and other Asian countries, North America, South America, Europe, and internationally.
Excellent balance sheet average dividend payer.
Market Insights
Community Narratives


