Microware Group Limited's (HKG:1985) Stock Is Going Strong: Have Financials A Role To Play?


Most readers would already be aware that Microware Group's (HKG:1985) stock increased significantly by 24% over the past month. As most would know, fundamentals are what usually guide market price movements over the long-term, so we decided to look at the company's key financial indicators today to determine if they have any role to play in the recent price movement. In this article, we decided to focus on Microware Group's ROE.
Return on Equity or ROE is a test of how effectively a company is growing its value and managing investors’ money. In other words, it is a profitability ratio which measures the rate of return on the capital provided by the company's shareholders.
Check out our latest analysis for Microware Group
How Do You Calculate Return On Equity?
ROE can be calculated by using the formula:
Return on Equity = Net Profit (from continuing operations) ÷ Shareholders' Equity
So, based on the above formula, the ROE for Microware Group is:
15% = HK$28m ÷ HK$193m (Based on the trailing twelve months to September 2023).
The 'return' refers to a company's earnings over the last year. So, this means that for every HK$1 of its shareholder's investments, the company generates a profit of HK$0.15.
What Is The Relationship Between ROE And Earnings Growth?
Thus far, we have learned that ROE measures how efficiently a company is generating its profits. Based on how much of its profits the company chooses to reinvest or "retain", we are then able to evaluate a company's future ability to generate profits. Generally speaking, other things being equal, firms with a high return on equity and profit retention, have a higher growth rate than firms that don’t share these attributes.
Microware Group's Earnings Growth And 15% ROE
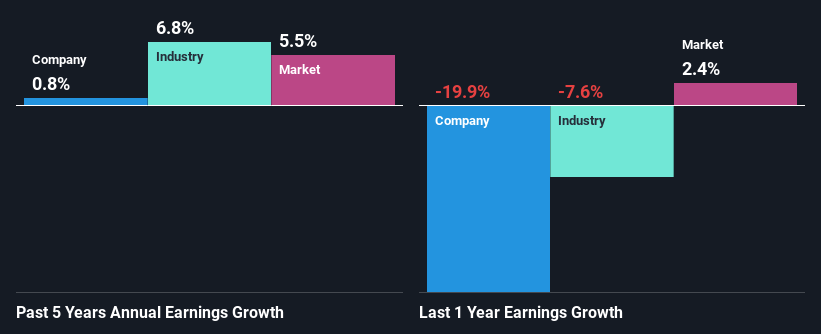
At first glance, Microware Group seems to have a decent ROE. Further, the company's ROE compares quite favorably to the industry average of 7.1%. Despite this, Microware Group's five year net income growth was quite flat over the past five years. Therefore, there could be some other aspects that could potentially be preventing the company from growing. These include low earnings retention or poor allocation of capital.
As a next step, we compared Microware Group's net income growth with the industry and were disappointed to see that the company's growth is lower than the industry average growth of 6.8% in the same period.
The basis for attaching value to a company is, to a great extent, tied to its earnings growth. It’s important for an investor to know whether the market has priced in the company's expected earnings growth (or decline). This then helps them determine if the stock is placed for a bright or bleak future. Is Microware Group fairly valued compared to other companies? These 3 valuation measures might help you decide.
Is Microware Group Using Its Retained Earnings Effectively?
The high three-year median payout ratio of 76% (meaning, the company retains only 24% of profits) for Microware Group suggests that the company's earnings growth was miniscule as a result of paying out a majority of its earnings.
Additionally, Microware Group has paid dividends over a period of seven years, which means that the company's management is determined to pay dividends even if it means little to no earnings growth.
Conclusion
On the whole, we do feel that Microware Group has some positive attributes. However, while the company does have a high ROE, its earnings growth number is quite disappointing. This can be blamed on the fact that it reinvests only a small portion of its profits and pays out the rest as dividends. Until now, we have only just grazed the surface of the company's past performance by looking at the company's fundamentals. So it may be worth checking this free detailed graph of Microware Group's past earnings, as well as revenue and cash flows to get a deeper insight into the company's performance.
New: Manage All Your Stock Portfolios in One Place
We've created the ultimate portfolio companion for stock investors, and it's free.
• Connect an unlimited number of Portfolios and see your total in one currency
• Be alerted to new Warning Signs or Risks via email or mobile
• Track the Fair Value of your stocks
Have feedback on this article? Concerned about the content? Get in touch with us directly. Alternatively, email editorial-team (at) simplywallst.com.
This article by Simply Wall St is general in nature. We provide commentary based on historical data and analyst forecasts only using an unbiased methodology and our articles are not intended to be financial advice. It does not constitute a recommendation to buy or sell any stock, and does not take account of your objectives, or your financial situation. We aim to bring you long-term focused analysis driven by fundamental data. Note that our analysis may not factor in the latest price-sensitive company announcements or qualitative material. Simply Wall St has no position in any stocks mentioned.
About SEHK:1985
Microware Group
An investment holding company, provides information technology (IT) infrastructure solutions and IT managed services in Hong Kong.
Adequate balance sheet with acceptable track record.
