Stock Analysis
- Hong Kong
- /
- Semiconductors
- /
- SEHK:757
Even after rising 13% this past week, Solargiga Energy Holdings (HKG:757) shareholders are still down 46% over the past three years

While it may not be enough for some shareholders, we think it is good to see the Solargiga Energy Holdings Limited (HKG:757) share price up 23% in a single quarter. But that doesn't change the fact that the returns over the last three years have been less than pleasing. Truth be told the share price declined 57% in three years and that return, Dear Reader, falls short of what you could have got from passive investing with an index fund.
On a more encouraging note the company has added HK$70m to its market cap in just the last 7 days, so let's see if we can determine what's driven the three-year loss for shareholders.
View our latest analysis for Solargiga Energy Holdings
Solargiga Energy Holdings wasn't profitable in the last twelve months, it is unlikely we'll see a strong correlation between its share price and its earnings per share (EPS). Arguably revenue is our next best option. Shareholders of unprofitable companies usually expect strong revenue growth. That's because fast revenue growth can be easily extrapolated to forecast profits, often of considerable size.
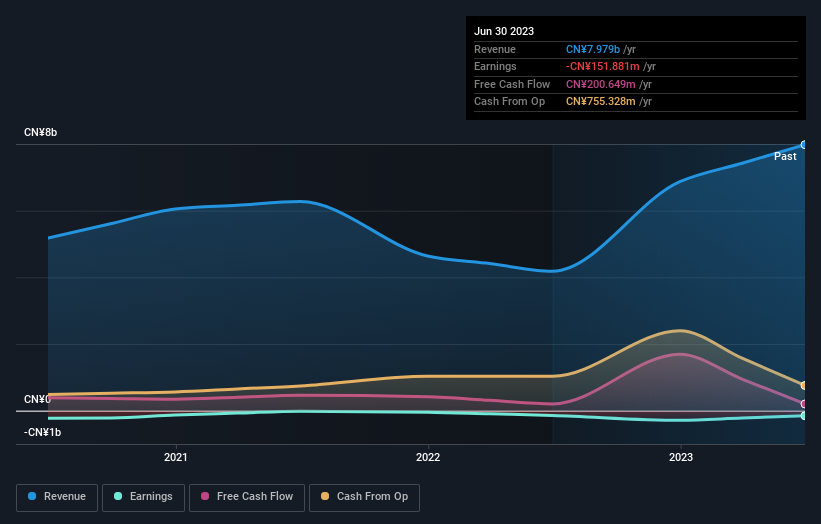
In the last three years, Solargiga Energy Holdings saw its revenue grow by 9.0% per year, compound. That's a fairly respectable growth rate. So some shareholders would be frustrated with the compound loss of 16% per year. To be frank we're surprised to see revenue growth and share price growth diverge so strongly. So this is one stock that might be worth investigating further, or even adding to your watchlist.
The graphic below depicts how earnings and revenue have changed over time (unveil the exact values by clicking on the image).
This free interactive report on Solargiga Energy Holdings' balance sheet strength is a great place to start, if you want to investigate the stock further.
What About The Total Shareholder Return (TSR)?
We'd be remiss not to mention the difference between Solargiga Energy Holdings' total shareholder return (TSR) and its share price return. Arguably the TSR is a more complete return calculation because it accounts for the value of dividends (as if they were reinvested), along with the hypothetical value of any discounted capital that have been offered to shareholders. Solargiga Energy Holdings hasn't been paying dividends, but its TSR of -46% exceeds its share price return of -57%, implying it has either spun-off a business, or raised capital at a discount; thereby providing additional value to shareholders.
A Different Perspective
While the broader market lost about 7.0% in the twelve months, Solargiga Energy Holdings shareholders did even worse, losing 32%. However, it could simply be that the share price has been impacted by broader market jitters. It might be worth keeping an eye on the fundamentals, in case there's a good opportunity. On the bright side, long term shareholders have made money, with a gain of 11% per year over half a decade. If the fundamental data continues to indicate long term sustainable growth, the current sell-off could be an opportunity worth considering. I find it very interesting to look at share price over the long term as a proxy for business performance. But to truly gain insight, we need to consider other information, too. Consider risks, for instance. Every company has them, and we've spotted 1 warning sign for Solargiga Energy Holdings you should know about.
If you like to buy stocks alongside management, then you might just love this free list of companies. (Hint: insiders have been buying them).
Please note, the market returns quoted in this article reflect the market weighted average returns of stocks that currently trade on Hong Kong exchanges.
Valuation is complex, but we're helping make it simple.
Find out whether Solargiga Energy Holdings is potentially over or undervalued by checking out our comprehensive analysis, which includes fair value estimates, risks and warnings, dividends, insider transactions and financial health.
View the Free AnalysisHave feedback on this article? Concerned about the content? Get in touch with us directly. Alternatively, email editorial-team (at) simplywallst.com.
This article by Simply Wall St is general in nature. We provide commentary based on historical data and analyst forecasts only using an unbiased methodology and our articles are not intended to be financial advice. It does not constitute a recommendation to buy or sell any stock, and does not take account of your objectives, or your financial situation. We aim to bring you long-term focused analysis driven by fundamental data. Note that our analysis may not factor in the latest price-sensitive company announcements or qualitative material. Simply Wall St has no position in any stocks mentioned.
About SEHK:757
Solargiga Energy Holdings
Solargiga Energy Holdings Limited, an investment holding company, engages in the manufacture, processing, and trading of polysilicon and monocrystalline silicon solar ingots and wafers in Mainland China.
Good value with adequate balance sheet.

