
Advertisement
- Hong Kong
- /
- Specialty Stores
- /
- SEHK:2420
There Are Reasons To Feel Uneasy About Zibuyu Group's (HKG:2420) Returns On Capital
What trends should we look for it we want to identify stocks that can multiply in value over the long term? Firstly, we'd want to identify a growing return on capital employed (ROCE) and then alongside that, an ever-increasing base of capital employed. Basically this means that a company has profitable initiatives that it can continue to reinvest in, which is a trait of a compounding machine. In light of that, when we looked at Zibuyu Group (HKG:2420) and its ROCE trend, we weren't exactly thrilled.
Understanding Return On Capital Employed (ROCE)
For those that aren't sure what ROCE is, it measures the amount of pre-tax profits a company can generate from the capital employed in its business. To calculate this metric for Zibuyu Group, this is the formula:
Return on Capital Employed = Earnings Before Interest and Tax (EBIT) ÷ (Total Assets - Current Liabilities)
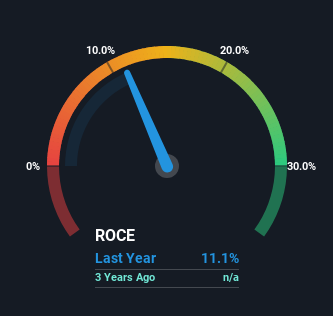
0.11 = CN¥90m ÷ (CN¥1.3b - CN¥530m) (Based on the trailing twelve months to June 2023).
So, Zibuyu Group has an ROCE of 11%. In absolute terms, that's a satisfactory return, but compared to the Specialty Retail industry average of 9.2% it's much better.
Check out our latest analysis for Zibuyu Group
In the above chart we have measured Zibuyu Group's prior ROCE against its prior performance, but the future is arguably more important. If you'd like to see what analysts are forecasting going forward, you should check out our free report for Zibuyu Group.
The Trend Of ROCE
On the surface, the trend of ROCE at Zibuyu Group doesn't inspire confidence. Over the last one year, returns on capital have decreased to 11% from 44% one year ago. Although, given both revenue and the amount of assets employed in the business have increased, it could suggest the company is investing in growth, and the extra capital has led to a short-term reduction in ROCE. And if the increased capital generates additional returns, the business, and thus shareholders, will benefit in the long run.
On a related note, Zibuyu Group has decreased its current liabilities to 40% of total assets. So we could link some of this to the decrease in ROCE. What's more, this can reduce some aspects of risk to the business because now the company's suppliers or short-term creditors are funding less of its operations. Some would claim this reduces the business' efficiency at generating ROCE since it is now funding more of the operations with its own money.
The Bottom Line
In summary, despite lower returns in the short term, we're encouraged to see that Zibuyu Group is reinvesting for growth and has higher sales as a result. And there could be an opportunity here if other metrics look good too, because the stock has declined 51% in the last year. So we think it'd be worthwhile to look further into this stock given the trends look encouraging.
Like most companies, Zibuyu Group does come with some risks, and we've found 4 warning signs that you should be aware of.
If you want to search for solid companies with great earnings, check out this free list of companies with good balance sheets and impressive returns on equity.
Valuation is complex, but we're here to simplify it.
Discover if Zibuyu Group might be undervalued or overvalued with our detailed analysis, featuring fair value estimates, potential risks, dividends, insider trades, and its financial condition.
Access Free AnalysisHave feedback on this article? Concerned about the content? Get in touch with us directly. Alternatively, email editorial-team (at) simplywallst.com.
This article by Simply Wall St is general in nature. We provide commentary based on historical data and analyst forecasts only using an unbiased methodology and our articles are not intended to be financial advice. It does not constitute a recommendation to buy or sell any stock, and does not take account of your objectives, or your financial situation. We aim to bring you long-term focused analysis driven by fundamental data. Note that our analysis may not factor in the latest price-sensitive company announcements or qualitative material. Simply Wall St has no position in any stocks mentioned.
About SEHK:2420
Zibuyu Group
An investment holding company, operates as a cross-border e-commerce company in China.
Undervalued with excellent balance sheet.
Market Insights

Advertisement
Community Narratives
The company that turned a verb into a global necessity and basically runs the modern internet, digital ads, smartphones, maps, and AI.
Fair Value US$300.00|7.1% undervalued
OS
Community Contributor
Flowers Foods Pays A Fair Price For Health
Fair Value US$16.12|26.4% undervalued
NV
Community Contributor
TMX Group will thrive with 33.3% profit margin and enduring market moat
Fair Value CA$49.90|0.8% overvalued
LI
Community Contributor
The "Molecular Pencil": Why Beam's Technology is Built to Win
Fair Value US$65.01|65.8% undervalued
DA
Community Contributor