- Hong Kong
- /
- Real Estate
- /
- SEHK:9608
Is Sundy Service Group Co. Ltd's (HKG:9608) Recent Stock Performance Influenced By Its Fundamentals In Any Way?


Sundy Service Group's (HKG:9608) stock is up by a considerable 15% over the past week. Given that stock prices are usually aligned with a company's financial performance in the long-term, we decided to study its financial indicators more closely to see if they had a hand to play in the recent price move. Specifically, we decided to study Sundy Service Group's ROE in this article.
Return on Equity or ROE is a test of how effectively a company is growing its value and managing investors’ money. Put another way, it reveals the company's success at turning shareholder investments into profits.
View our latest analysis for Sundy Service Group
How To Calculate Return On Equity?
Return on equity can be calculated by using the formula:
Return on Equity = Net Profit (from continuing operations) ÷ Shareholders' Equity
So, based on the above formula, the ROE for Sundy Service Group is:
5.7% = CN¥20m ÷ CN¥355m (Based on the trailing twelve months to June 2023).
The 'return' is the income the business earned over the last year. Another way to think of that is that for every HK$1 worth of equity, the company was able to earn HK$0.06 in profit.
What Has ROE Got To Do With Earnings Growth?
So far, we've learned that ROE is a measure of a company's profitability. We now need to evaluate how much profit the company reinvests or "retains" for future growth which then gives us an idea about the growth potential of the company. Generally speaking, other things being equal, firms with a high return on equity and profit retention, have a higher growth rate than firms that don’t share these attributes.
Sundy Service Group's Earnings Growth And 5.7% ROE
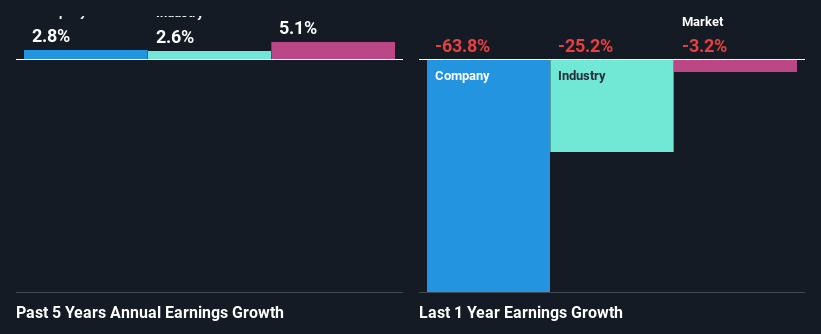
On the face of it, Sundy Service Group's ROE is not much to talk about. However, given that the company's ROE is similar to the average industry ROE of 5.8%, we may spare it some thought. On the other hand, Sundy Service Group reported a fairly low 2.8% net income growth over the past five years. Remember, the company's ROE is not particularly great to begin with. So this could also be one of the reasons behind the company's low growth in earnings.
As a next step, we compared Sundy Service Group's net income growth with the industry and found that the company has a similar growth figure when compared with the industry average growth rate of 2.6% in the same period.
Earnings growth is an important metric to consider when valuing a stock. What investors need to determine next is if the expected earnings growth, or the lack of it, is already built into the share price. This then helps them determine if the stock is placed for a bright or bleak future. One good indicator of expected earnings growth is the P/E ratio which determines the price the market is willing to pay for a stock based on its earnings prospects. So, you may want to check if Sundy Service Group is trading on a high P/E or a low P/E, relative to its industry.
Is Sundy Service Group Making Efficient Use Of Its Profits?
Sundy Service Group doesn't pay any dividend currently which essentially means that it has been reinvesting all of its profits into the business. This doesn't explain the low earnings growth number that we discussed above. So there might be other factors at play here which could potentially be hampering growth. For example, the business has faced some headwinds.
Conclusion
On the whole, we do feel that Sundy Service Group has some positive attributes. Namely, its respectable earnings growth, which it achieved due to it retaining most of its profits. However, given the low ROE, investors may not be benefitting from all that reinvestment after all. While we won't completely dismiss the company, what we would do, is try to ascertain how risky the business is to make a more informed decision around the company. To know the 3 risks we have identified for Sundy Service Group visit our risks dashboard for free.
New: Manage All Your Stock Portfolios in One Place
We've created the ultimate portfolio companion for stock investors, and it's free.
• Connect an unlimited number of Portfolios and see your total in one currency
• Be alerted to new Warning Signs or Risks via email or mobile
• Track the Fair Value of your stocks
Have feedback on this article? Concerned about the content? Get in touch with us directly. Alternatively, email editorial-team (at) simplywallst.com.
This article by Simply Wall St is general in nature. We provide commentary based on historical data and analyst forecasts only using an unbiased methodology and our articles are not intended to be financial advice. It does not constitute a recommendation to buy or sell any stock, and does not take account of your objectives, or your financial situation. We aim to bring you long-term focused analysis driven by fundamental data. Note that our analysis may not factor in the latest price-sensitive company announcements or qualitative material. Simply Wall St has no position in any stocks mentioned.
About SEHK:9608
Sundy Service Group
An investment holding company, operates as an integrated property management service provider in the People’s Republic of China.
Flawless balance sheet moderate.
