Stock Analysis
- Hong Kong
- /
- Real Estate
- /
- SEHK:224
Pioneer Global Group (HKG:224) earnings and shareholder returns have been trending downwards for the last five years, but the stock pops 15% this past week


The main aim of stock picking is to find the market-beating stocks. But the main game is to find enough winners to more than offset the losers At this point some shareholders may be questioning their investment in Pioneer Global Group Limited (HKG:224), since the last five years saw the share price fall 51%.
While the stock has risen 15% in the past week but long term shareholders are still in the red, let's see what the fundamentals can tell us.
View our latest analysis for Pioneer Global Group
In his essay The Superinvestors of Graham-and-Doddsville Warren Buffett described how share prices do not always rationally reflect the value of a business. One imperfect but simple way to consider how the market perception of a company has shifted is to compare the change in the earnings per share (EPS) with the share price movement.
During five years of share price growth, Pioneer Global Group moved from a loss to profitability. That would generally be considered a positive, so we are surprised to see the share price is down. Other metrics might give us a better handle on how its value is changing over time.
The modest 1.7% dividend yield is unlikely to be guiding the market view of the stock. It could be that the revenue decline of 9.8% per year is viewed as evidence that Pioneer Global Group is shrinking. This has probably encouraged some shareholders to sell down the stock.
The graphic below depicts how earnings and revenue have changed over time (unveil the exact values by clicking on the image).
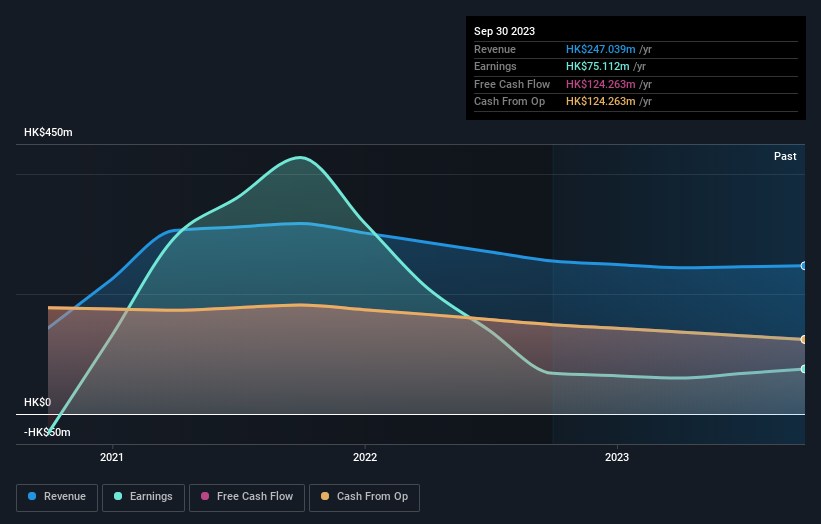
We consider it positive that insiders have made significant purchases in the last year. Having said that, most people consider earnings and revenue growth trends to be a more meaningful guide to the business. Dive deeper into the earnings by checking this interactive graph of Pioneer Global Group's earnings, revenue and cash flow.
What About Dividends?
As well as measuring the share price return, investors should also consider the total shareholder return (TSR). The TSR incorporates the value of any spin-offs or discounted capital raisings, along with any dividends, based on the assumption that the dividends are reinvested. Arguably, the TSR gives a more comprehensive picture of the return generated by a stock. We note that for Pioneer Global Group the TSR over the last 5 years was -47%, which is better than the share price return mentioned above. And there's no prize for guessing that the dividend payments largely explain the divergence!
A Different Perspective
We regret to report that Pioneer Global Group shareholders are down 6.8% for the year (even including dividends). Unfortunately, that's worse than the broader market decline of 2.9%. Having said that, it's inevitable that some stocks will be oversold in a falling market. The key is to keep your eyes on the fundamental developments. However, the loss over the last year isn't as bad as the 8% per annum loss investors have suffered over the last half decade. We would want clear information suggesting the company will grow, before taking the view that the share price will stabilize. It's always interesting to track share price performance over the longer term. But to understand Pioneer Global Group better, we need to consider many other factors. For instance, we've identified 1 warning sign for Pioneer Global Group that you should be aware of.
Pioneer Global Group is not the only stock that insiders are buying. For those who like to find winning investments this free list of growing companies with recent insider purchasing, could be just the ticket.
Please note, the market returns quoted in this article reflect the market weighted average returns of stocks that currently trade on Hong Kong exchanges.
Valuation is complex, but we're helping make it simple.
Find out whether Pioneer Global Group is potentially over or undervalued by checking out our comprehensive analysis, which includes fair value estimates, risks and warnings, dividends, insider transactions and financial health.
View the Free AnalysisHave feedback on this article? Concerned about the content? Get in touch with us directly. Alternatively, email editorial-team (at) simplywallst.com.
This article by Simply Wall St is general in nature. We provide commentary based on historical data and analyst forecasts only using an unbiased methodology and our articles are not intended to be financial advice. It does not constitute a recommendation to buy or sell any stock, and does not take account of your objectives, or your financial situation. We aim to bring you long-term focused analysis driven by fundamental data. Note that our analysis may not factor in the latest price-sensitive company announcements or qualitative material. Simply Wall St has no position in any stocks mentioned.
About SEHK:224
Pioneer Global Group
An investment holding company, engages in the real estate investment business in Hong Kong and internationally.
Proven track record with imperfect balance sheet.

