- Hong Kong
- /
- Real Estate
- /
- SEHK:207
The five-year loss for Joy City Property (HKG:207) shareholders likely driven by its shrinking earnings

Joy City Property Limited (HKG:207) shareholders should be happy to see the share price up 17% in the last month. But that is little comfort to those holding over the last half decade, sitting on a big loss. The share price has failed to impress anyone , down a sizable 73% during that time. So we're hesitant to put much weight behind the short term increase. Of course, this could be the start of a turnaround.
Although the past week has been more reassuring for shareholders, they're still in the red over the last five years, so let's see if the underlying business has been responsible for the decline.
View our latest analysis for Joy City Property
To paraphrase Benjamin Graham: Over the short term the market is a voting machine, but over the long term it's a weighing machine. One flawed but reasonable way to assess how sentiment around a company has changed is to compare the earnings per share (EPS) with the share price.
During the five years over which the share price declined, Joy City Property's earnings per share (EPS) dropped by 21% each year. This change in EPS is reasonably close to the 23% average annual decrease in the share price. That suggests that the market sentiment around the company hasn't changed much over that time. So it's fair to say the share price has been responding to changes in EPS.
You can see below how EPS has changed over time (discover the exact values by clicking on the image).
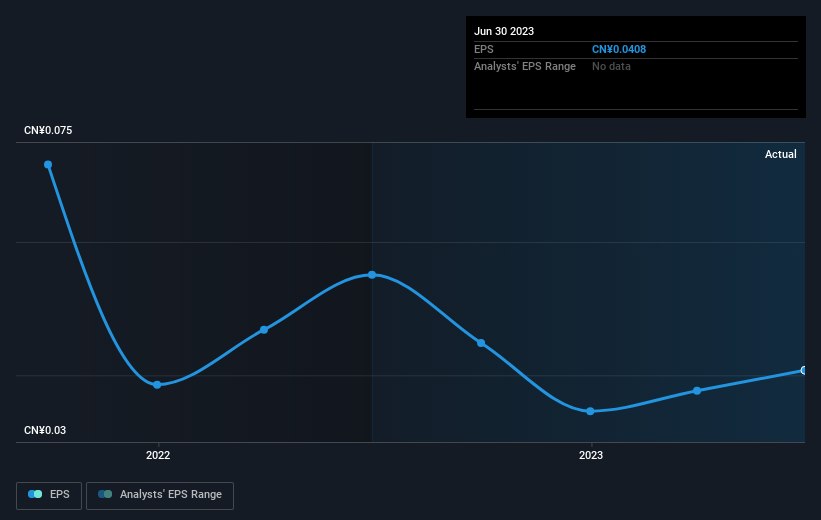
This free interactive report on Joy City Property's earnings, revenue and cash flow is a great place to start, if you want to investigate the stock further.
What About Dividends?
When looking at investment returns, it is important to consider the difference between total shareholder return (TSR) and share price return. The TSR incorporates the value of any spin-offs or discounted capital raisings, along with any dividends, based on the assumption that the dividends are reinvested. So for companies that pay a generous dividend, the TSR is often a lot higher than the share price return. We note that for Joy City Property the TSR over the last 5 years was -66%, which is better than the share price return mentioned above. This is largely a result of its dividend payments!
A Different Perspective
We regret to report that Joy City Property shareholders are down 23% for the year (even including dividends). Unfortunately, that's worse than the broader market decline of 15%. However, it could simply be that the share price has been impacted by broader market jitters. It might be worth keeping an eye on the fundamentals, in case there's a good opportunity. Regrettably, last year's performance caps off a bad run, with the shareholders facing a total loss of 11% per year over five years. We realise that Baron Rothschild has said investors should "buy when there is blood on the streets", but we caution that investors should first be sure they are buying a high quality business. It's always interesting to track share price performance over the longer term. But to understand Joy City Property better, we need to consider many other factors. Even so, be aware that Joy City Property is showing 4 warning signs in our investment analysis , and 2 of those shouldn't be ignored...
If you would prefer to check out another company -- one with potentially superior financials -- then do not miss this free list of companies that have proven they can grow earnings.
Please note, the market returns quoted in this article reflect the market weighted average returns of stocks that currently trade on Hong Kong exchanges.
New: Manage All Your Stock Portfolios in One Place
We've created the ultimate portfolio companion for stock investors, and it's free.
• Connect an unlimited number of Portfolios and see your total in one currency
• Be alerted to new Warning Signs or Risks via email or mobile
• Track the Fair Value of your stocks
Have feedback on this article? Concerned about the content? Get in touch with us directly. Alternatively, email editorial-team (at) simplywallst.com.
This article by Simply Wall St is general in nature. We provide commentary based on historical data and analyst forecasts only using an unbiased methodology and our articles are not intended to be financial advice. It does not constitute a recommendation to buy or sell any stock, and does not take account of your objectives, or your financial situation. We aim to bring you long-term focused analysis driven by fundamental data. Note that our analysis may not factor in the latest price-sensitive company announcements or qualitative material. Simply Wall St has no position in any stocks mentioned.
About SEHK:207
Joy City Property
An investment holding company, engages in real estate business in Mainland China and Hong Kong.
Slight with mediocre balance sheet.
