Shandong Xinhua Pharmaceutical (HKG:719) jumps 11% this week, though earnings growth is still tracking behind three-year shareholder returns


By buying an index fund, you can roughly match the market return with ease. But if you pick the right individual stocks, you could make more than that. Just take a look at Shandong Xinhua Pharmaceutical Company Limited (HKG:719), which is up 46%, over three years, soundly beating the market decline of 20% (not including dividends).
On the back of a solid 7-day performance, let's check what role the company's fundamentals have played in driving long term shareholder returns.
View our latest analysis for Shandong Xinhua Pharmaceutical
In his essay The Superinvestors of Graham-and-Doddsville Warren Buffett described how share prices do not always rationally reflect the value of a business. One way to examine how market sentiment has changed over time is to look at the interaction between a company's share price and its earnings per share (EPS).
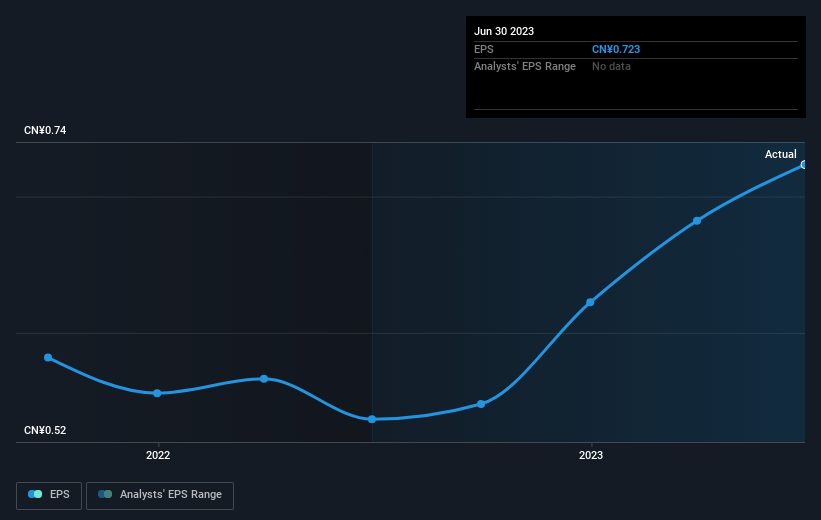
Shandong Xinhua Pharmaceutical was able to grow its EPS at 12% per year over three years, sending the share price higher. We note that the 13% yearly (average) share price gain isn't too far from the EPS growth rate. Coincidence? Probably not. This observation indicates that the market's attitude to the business hasn't changed all that much. Rather, the share price has approximately tracked EPS growth.
You can see how EPS has changed over time in the image below (click on the chart to see the exact values).
This free interactive report on Shandong Xinhua Pharmaceutical's earnings, revenue and cash flow is a great place to start, if you want to investigate the stock further.
What About Dividends?
It is important to consider the total shareholder return, as well as the share price return, for any given stock. The TSR incorporates the value of any spin-offs or discounted capital raisings, along with any dividends, based on the assumption that the dividends are reinvested. It's fair to say that the TSR gives a more complete picture for stocks that pay a dividend. In the case of Shandong Xinhua Pharmaceutical, it has a TSR of 63% for the last 3 years. That exceeds its share price return that we previously mentioned. The dividends paid by the company have thusly boosted the total shareholder return.
A Different Perspective
We're pleased to report that Shandong Xinhua Pharmaceutical shareholders have received a total shareholder return of 44% over one year. That's including the dividend. Since the one-year TSR is better than the five-year TSR (the latter coming in at 12% per year), it would seem that the stock's performance has improved in recent times. Given the share price momentum remains strong, it might be worth taking a closer look at the stock, lest you miss an opportunity. I find it very interesting to look at share price over the long term as a proxy for business performance. But to truly gain insight, we need to consider other information, too. Consider for instance, the ever-present spectre of investment risk. We've identified 1 warning sign with Shandong Xinhua Pharmaceutical , and understanding them should be part of your investment process.
Of course, you might find a fantastic investment by looking elsewhere. So take a peek at this free list of companies we expect will grow earnings.
Please note, the market returns quoted in this article reflect the market weighted average returns of stocks that currently trade on Hong Kong exchanges.
New: Manage All Your Stock Portfolios in One Place
We've created the ultimate portfolio companion for stock investors, and it's free.
• Connect an unlimited number of Portfolios and see your total in one currency
• Be alerted to new Warning Signs or Risks via email or mobile
• Track the Fair Value of your stocks
Have feedback on this article? Concerned about the content? Get in touch with us directly. Alternatively, email editorial-team (at) simplywallst.com.
This article by Simply Wall St is general in nature. We provide commentary based on historical data and analyst forecasts only using an unbiased methodology and our articles are not intended to be financial advice. It does not constitute a recommendation to buy or sell any stock, and does not take account of your objectives, or your financial situation. We aim to bring you long-term focused analysis driven by fundamental data. Note that our analysis may not factor in the latest price-sensitive company announcements or qualitative material. Simply Wall St has no position in any stocks mentioned.
About SEHK:719
Shandong Xinhua Pharmaceutical
Through its subsidiaries, develops, manufactures, and sells bulk pharmaceuticals, preparations, and chemical products in the People's Republic of China, the Americas, Europe, and internationally.
Flawless balance sheet with proven track record.
