Could The Market Be Wrong About SSY Group Limited (HKG:2005) Given Its Attractive Financial Prospects?


It is hard to get excited after looking at SSY Group's (HKG:2005) recent performance, when its stock has declined 18% over the past three months. However, stock prices are usually driven by a company’s financial performance over the long term, which in this case looks quite promising. Particularly, we will be paying attention to SSY Group's ROE today.
Return on equity or ROE is a key measure used to assess how efficiently a company's management is utilizing the company's capital. In other words, it is a profitability ratio which measures the rate of return on the capital provided by the company's shareholders.
View our latest analysis for SSY Group
How Is ROE Calculated?
The formula for ROE is:
Return on Equity = Net Profit (from continuing operations) ÷ Shareholders' Equity
So, based on the above formula, the ROE for SSY Group is:
18% = HK$1.3b ÷ HK$7.3b (Based on the trailing twelve months to December 2023).
The 'return' is the profit over the last twelve months. One way to conceptualize this is that for each HK$1 of shareholders' capital it has, the company made HK$0.18 in profit.
What Is The Relationship Between ROE And Earnings Growth?
Thus far, we have learned that ROE measures how efficiently a company is generating its profits. Depending on how much of these profits the company reinvests or "retains", and how effectively it does so, we are then able to assess a company’s earnings growth potential. Assuming everything else remains unchanged, the higher the ROE and profit retention, the higher the growth rate of a company compared to companies that don't necessarily bear these characteristics.
A Side By Side comparison of SSY Group's Earnings Growth And 18% ROE
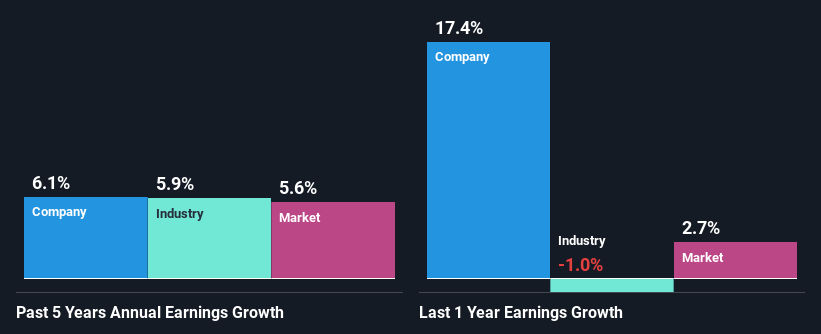
To begin with, SSY Group seems to have a respectable ROE. On comparing with the average industry ROE of 12% the company's ROE looks pretty remarkable. This certainly adds some context to SSY Group's decent 6.1% net income growth seen over the past five years.
Next, on comparing SSY Group's net income growth with the industry, we found that the company's reported growth is similar to the industry average growth rate of 5.9% over the last few years.
Earnings growth is an important metric to consider when valuing a stock. The investor should try to establish if the expected growth or decline in earnings, whichever the case may be, is priced in. By doing so, they will have an idea if the stock is headed into clear blue waters or if swampy waters await. If you're wondering about SSY Group's's valuation, check out this gauge of its price-to-earnings ratio, as compared to its industry.
Is SSY Group Efficiently Re-investing Its Profits?
SSY Group has a three-year median payout ratio of 38%, which implies that it retains the remaining 62% of its profits. This suggests that its dividend is well covered, and given the decent growth seen by the company, it looks like management is reinvesting its earnings efficiently.
Additionally, SSY Group has paid dividends over a period of at least ten years which means that the company is pretty serious about sharing its profits with shareholders. Upon studying the latest analysts' consensus data, we found that the company's future payout ratio is expected to drop to 13% over the next three years. Regardless, the ROE is not expected to change much for the company despite the lower expected payout ratio.
Conclusion
Overall, we are quite pleased with SSY Group's performance. In particular, it's great to see that the company is investing heavily into its business and along with a high rate of return, that has resulted in a sizeable growth in its earnings. With that said, the latest industry analyst forecasts reveal that the company's earnings are expected to accelerate. To know more about the latest analysts predictions for the company, check out this visualization of analyst forecasts for the company.
New: Manage All Your Stock Portfolios in One Place
We've created the ultimate portfolio companion for stock investors, and it's free.
• Connect an unlimited number of Portfolios and see your total in one currency
• Be alerted to new Warning Signs or Risks via email or mobile
• Track the Fair Value of your stocks
Have feedback on this article? Concerned about the content? Get in touch with us directly. Alternatively, email editorial-team (at) simplywallst.com.
This article by Simply Wall St is general in nature. We provide commentary based on historical data and analyst forecasts only using an unbiased methodology and our articles are not intended to be financial advice. It does not constitute a recommendation to buy or sell any stock, and does not take account of your objectives, or your financial situation. We aim to bring you long-term focused analysis driven by fundamental data. Note that our analysis may not factor in the latest price-sensitive company announcements or qualitative material. Simply Wall St has no position in any stocks mentioned.
Have feedback on this article? Concerned about the content? Get in touch with us directly. Alternatively, email editorial-team@simplywallst.com
About SEHK:2005
SSY Group
An investment holding company, researches, develops, manufactures, trades in, and sells various pharmaceutical products to hospitals and distributors in the People’s Republic of China and internationally.
Undervalued with solid track record.
