The five-year shareholder returns and company earnings persist lower as Tong Ren Tang Technologies (HKG:1666) stock falls a further 5.9% in past week


Ideally, your overall portfolio should beat the market average. But even the best stock picker will only win with some selections. At this point some shareholders may be questioning their investment in Tong Ren Tang Technologies Co. Ltd. (HKG:1666), since the last five years saw the share price fall 51%. The falls have accelerated recently, with the share price down 22% in the last three months.
Since Tong Ren Tang Technologies has shed HK$410m from its value in the past 7 days, let's see if the longer term decline has been driven by the business' economics.
Check out our latest analysis for Tong Ren Tang Technologies
To paraphrase Benjamin Graham: Over the short term the market is a voting machine, but over the long term it's a weighing machine. One way to examine how market sentiment has changed over time is to look at the interaction between a company's share price and its earnings per share (EPS).
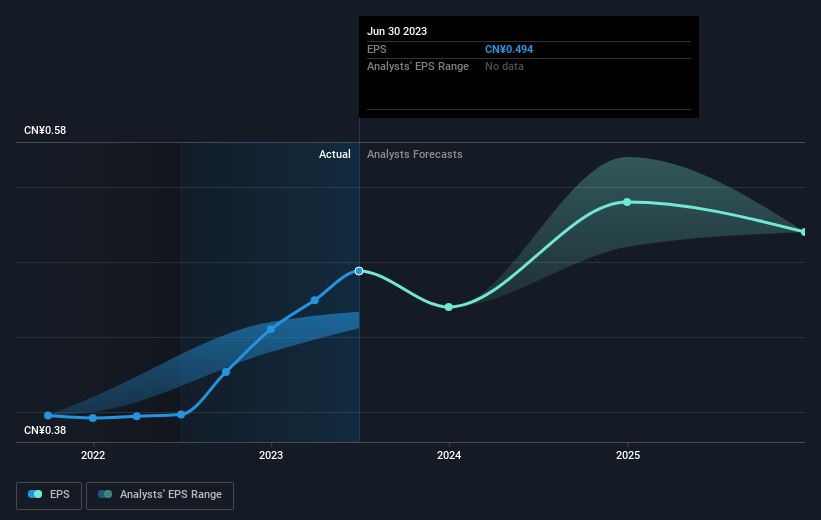
During the five years over which the share price declined, Tong Ren Tang Technologies' earnings per share (EPS) dropped by 1.5% each year. This reduction in EPS is less than the 13% annual reduction in the share price. So it seems the market was too confident about the business, in the past. The low P/E ratio of 9.56 further reflects this reticence.
The company's earnings per share (over time) is depicted in the image below (click to see the exact numbers).
We know that Tong Ren Tang Technologies has improved its bottom line lately, but is it going to grow revenue? This free report showing analyst revenue forecasts should help you figure out if the EPS growth can be sustained.
What About Dividends?
As well as measuring the share price return, investors should also consider the total shareholder return (TSR). The TSR is a return calculation that accounts for the value of cash dividends (assuming that any dividend received was reinvested) and the calculated value of any discounted capital raisings and spin-offs. It's fair to say that the TSR gives a more complete picture for stocks that pay a dividend. As it happens, Tong Ren Tang Technologies' TSR for the last 5 years was -44%, which exceeds the share price return mentioned earlier. This is largely a result of its dividend payments!
A Different Perspective
While the broader market lost about 11% in the twelve months, Tong Ren Tang Technologies shareholders did even worse, losing 15% (even including dividends). However, it could simply be that the share price has been impacted by broader market jitters. It might be worth keeping an eye on the fundamentals, in case there's a good opportunity. Unfortunately, last year's performance may indicate unresolved challenges, given that it was worse than the annualised loss of 8% over the last half decade. Generally speaking long term share price weakness can be a bad sign, though contrarian investors might want to research the stock in hope of a turnaround. Keeping this in mind, a solid next step might be to take a look at Tong Ren Tang Technologies' dividend track record. This free interactive graph is a great place to start.
If you would prefer to check out another company -- one with potentially superior financials -- then do not miss this free list of companies that have proven they can grow earnings.
Please note, the market returns quoted in this article reflect the market weighted average returns of stocks that currently trade on Hong Kong exchanges.
Valuation is complex, but we're here to simplify it.
Discover if Tong Ren Tang Technologies might be undervalued or overvalued with our detailed analysis, featuring fair value estimates, potential risks, dividends, insider trades, and its financial condition.
Access Free AnalysisHave feedback on this article? Concerned about the content? Get in touch with us directly. Alternatively, email editorial-team (at) simplywallst.com.
This article by Simply Wall St is general in nature. We provide commentary based on historical data and analyst forecasts only using an unbiased methodology and our articles are not intended to be financial advice. It does not constitute a recommendation to buy or sell any stock, and does not take account of your objectives, or your financial situation. We aim to bring you long-term focused analysis driven by fundamental data. Note that our analysis may not factor in the latest price-sensitive company announcements or qualitative material. Simply Wall St has no position in any stocks mentioned.
About SEHK:1666
Tong Ren Tang Technologies
Manufactures and sells Chinese medicine products in Mainland China and internationally.
Flawless balance sheet established dividend payer.
