Stock Analysis
- Hong Kong
- /
- Metals and Mining
- /
- SEHK:3993
CMOC Group Full Year 2023 Earnings: EPS Beats Expectations
CMOC Group (HKG:3993) Full Year 2023 Results
Key Financial Results
- Revenue: CN¥186.3b (up 7.7% from FY 2022).
- Net income: CN¥8.25b (up 36% from FY 2022).
- Profit margin: 4.4% (up from 3.5% in FY 2022). The increase in margin was driven by higher revenue.
- EPS: CN¥0.38 (up from CN¥0.28 in FY 2022).
3993 Production and Reserves
Copper- Production: 0.42 Mt (0.277 Mt in FY 2022)
- Proved and probable reserves (ore): 325.4 Mt (445.4 Mt in FY 2022)
- Number of mines: 2 (3 in FY 2022)
- Production: 15,635 t (15,114 t in FY 2022)
- Proved and probable reserves (ore): 122.1 Mt
- Number of mines: 2
- Production: 18.772 troy koz (16.221 troy koz in FY 2022)
All figures shown in the chart above are for the trailing 12 month (TTM) period
CMOC Group EPS Beats Expectations
Revenue was in line with analyst estimates. Earnings per share (EPS) surpassed analyst estimates by 20%.
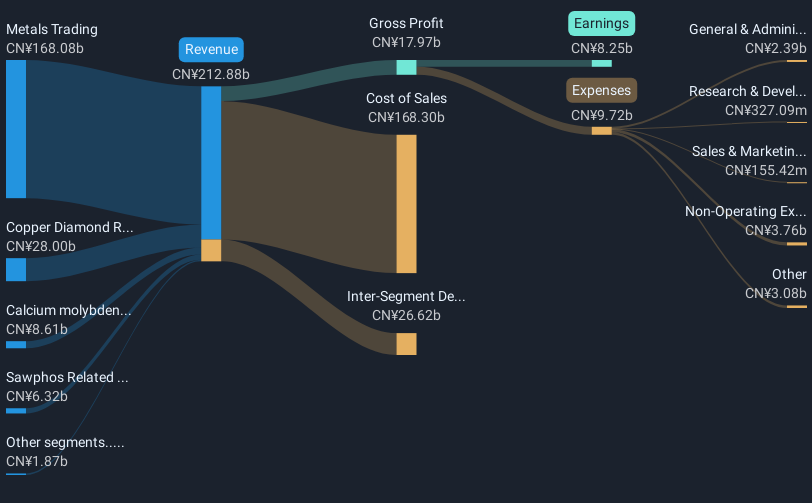
The primary driver behind last 12 months revenue was the Metals Trading segment contributing a total revenue of CN¥168.1b (90% of total revenue). Notably, cost of sales worth CN¥168.3b amounted to 90% of total revenue thereby underscoring the impact on earnings. The most substantial expense, totaling CN¥3.76b were related to Non-Operating costs. This indicates that a significant portion of the company's costs is related to non-core activities. Explore how 3993's revenue and expenses shape its earnings.
Looking ahead, revenue is forecast to grow 5.1% p.a. on average during the next 3 years, compared to a 6.0% growth forecast for the Metals and Mining industry in Hong Kong.
Performance of the Hong Kong Metals and Mining industry.
The company's shares are up 4.1% from a week ago.
Risk Analysis
We should say that we've discovered 1 warning sign for CMOC Group that you should be aware of before investing here.
Valuation is complex, but we're helping make it simple.
Find out whether CMOC Group is potentially over or undervalued by checking out our comprehensive analysis, which includes fair value estimates, risks and warnings, dividends, insider transactions and financial health.
View the Free AnalysisHave feedback on this article? Concerned about the content? Get in touch with us directly. Alternatively, email editorial-team (at) simplywallst.com.
This article by Simply Wall St is general in nature. We provide commentary based on historical data and analyst forecasts only using an unbiased methodology and our articles are not intended to be financial advice. It does not constitute a recommendation to buy or sell any stock, and does not take account of your objectives, or your financial situation. We aim to bring you long-term focused analysis driven by fundamental data. Note that our analysis may not factor in the latest price-sensitive company announcements or qualitative material. Simply Wall St has no position in any stocks mentioned.
About SEHK:3993
CMOC Group
CMOC Group Limited, together with its subsidiaries, engages in the mining, beneficiation, smelting, refining, and trading of copper, cobalt, molybdenum, phosphates, and other base and rare metals.
Solid track record with excellent balance sheet.

