Investors who have held AIA Group (HKG:1299) over the last three years have watched its earnings decline along with their investment


One of the frustrations of investing is when a stock goes down. But it's hard to avoid some disappointing investments when the overall market is down. While the AIA Group Limited (HKG:1299) share price is down 32% in the last three years, the total return to shareholders (which includes dividends) was -28%. That's better than the market which declined 31% over the last three years. And the ride hasn't got any smoother in recent times over the last year, with the price 28% lower in that time. But it's up 9.8% in the last week.
On a more encouraging note the company has added HK$65b to its market cap in just the last 7 days, so let's see if we can determine what's driven the three-year loss for shareholders.
Check out our latest analysis for AIA Group
In his essay The Superinvestors of Graham-and-Doddsville Warren Buffett described how share prices do not always rationally reflect the value of a business. One flawed but reasonable way to assess how sentiment around a company has changed is to compare the earnings per share (EPS) with the share price.
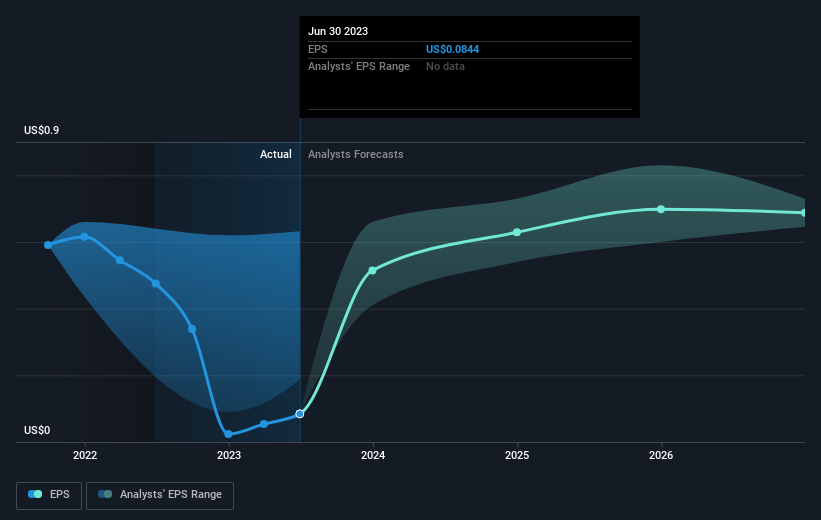
AIA Group saw its EPS decline at a compound rate of 40% per year, over the last three years. This fall in the EPS is worse than the 12% compound annual share price fall. So the market may not be too worried about the EPS figure, at the moment -- or it may have previously priced some of the drop in. This positive sentiment is also reflected in the generous P/E ratio of 94.99.
You can see how EPS has changed over time in the image below (click on the chart to see the exact values).
We consider it positive that insiders have made significant purchases in the last year. Even so, future earnings will be far more important to whether current shareholders make money. Before buying or selling a stock, we always recommend a close examination of historic growth trends, available here..
What About Dividends?
When looking at investment returns, it is important to consider the difference between total shareholder return (TSR) and share price return. The TSR incorporates the value of any spin-offs or discounted capital raisings, along with any dividends, based on the assumption that the dividends are reinvested. Arguably, the TSR gives a more comprehensive picture of the return generated by a stock. In the case of AIA Group, it has a TSR of -28% for the last 3 years. That exceeds its share price return that we previously mentioned. The dividends paid by the company have thusly boosted the total shareholder return.
A Different Perspective
While the broader market lost about 19% in the twelve months, AIA Group shareholders did even worse, losing 26% (even including dividends). Having said that, it's inevitable that some stocks will be oversold in a falling market. The key is to keep your eyes on the fundamental developments. On the bright side, long term shareholders have made money, with a gain of 0.2% per year over half a decade. It could be that the recent sell-off is an opportunity, so it may be worth checking the fundamental data for signs of a long term growth trend. It's always interesting to track share price performance over the longer term. But to understand AIA Group better, we need to consider many other factors. Consider risks, for instance. Every company has them, and we've spotted 2 warning signs for AIA Group you should know about.
There are plenty of other companies that have insiders buying up shares. You probably do not want to miss this free list of growing companies that insiders are buying.
Please note, the market returns quoted in this article reflect the market weighted average returns of stocks that currently trade on Hong Kong exchanges.
New: Manage All Your Stock Portfolios in One Place
We've created the ultimate portfolio companion for stock investors, and it's free.
• Connect an unlimited number of Portfolios and see your total in one currency
• Be alerted to new Warning Signs or Risks via email or mobile
• Track the Fair Value of your stocks
Have feedback on this article? Concerned about the content? Get in touch with us directly. Alternatively, email editorial-team (at) simplywallst.com.
This article by Simply Wall St is general in nature. We provide commentary based on historical data and analyst forecasts only using an unbiased methodology and our articles are not intended to be financial advice. It does not constitute a recommendation to buy or sell any stock, and does not take account of your objectives, or your financial situation. We aim to bring you long-term focused analysis driven by fundamental data. Note that our analysis may not factor in the latest price-sensitive company announcements or qualitative material. Simply Wall St has no position in any stocks mentioned.
About SEHK:1299
Proven track record with adequate balance sheet and pays a dividend.
