- Hong Kong
- /
- Medical Equipment
- /
- SEHK:1858
Beijing Chunlizhengda Medical Instruments' (HKG:1858) five-year earnings growth trails the decent shareholder returns


Beijing Chunlizhengda Medical Instruments Co., Ltd. (HKG:1858) shareholders might be concerned after seeing the share price drop 25% in the last quarter. Looking further back, the stock has generated good profits over five years. After all, the share price is up a market-beating 85% in that time. While the long term returns are impressive, we do have some sympathy for those who bought more recently, given the 53% drop, in the last year.
On the back of a solid 7-day performance, let's check what role the company's fundamentals have played in driving long term shareholder returns.
View our latest analysis for Beijing Chunlizhengda Medical Instruments
While markets are a powerful pricing mechanism, share prices reflect investor sentiment, not just underlying business performance. One imperfect but simple way to consider how the market perception of a company has shifted is to compare the change in the earnings per share (EPS) with the share price movement.
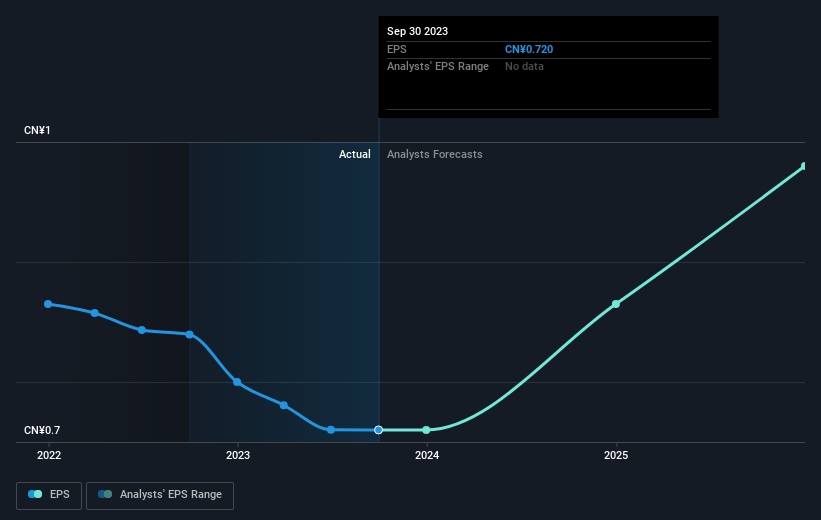
Over half a decade, Beijing Chunlizhengda Medical Instruments managed to grow its earnings per share at 22% a year. The EPS growth is more impressive than the yearly share price gain of 13% over the same period. So it seems the market isn't so enthusiastic about the stock these days.
The company's earnings per share (over time) is depicted in the image below (click to see the exact numbers).
It might be well worthwhile taking a look at our free report on Beijing Chunlizhengda Medical Instruments' earnings, revenue and cash flow.
What About Dividends?
As well as measuring the share price return, investors should also consider the total shareholder return (TSR). The TSR incorporates the value of any spin-offs or discounted capital raisings, along with any dividends, based on the assumption that the dividends are reinvested. So for companies that pay a generous dividend, the TSR is often a lot higher than the share price return. In the case of Beijing Chunlizhengda Medical Instruments, it has a TSR of 96% for the last 5 years. That exceeds its share price return that we previously mentioned. And there's no prize for guessing that the dividend payments largely explain the divergence!
A Different Perspective
We regret to report that Beijing Chunlizhengda Medical Instruments shareholders are down 52% for the year (even including dividends). Unfortunately, that's worse than the broader market decline of 10%. Having said that, it's inevitable that some stocks will be oversold in a falling market. The key is to keep your eyes on the fundamental developments. Longer term investors wouldn't be so upset, since they would have made 14%, each year, over five years. If the fundamental data continues to indicate long term sustainable growth, the current sell-off could be an opportunity worth considering. I find it very interesting to look at share price over the long term as a proxy for business performance. But to truly gain insight, we need to consider other information, too. For instance, we've identified 1 warning sign for Beijing Chunlizhengda Medical Instruments that you should be aware of.
If you like to buy stocks alongside management, then you might just love this free list of companies. (Hint: insiders have been buying them).
Please note, the market returns quoted in this article reflect the market weighted average returns of stocks that currently trade on Hong Kong exchanges.
Valuation is complex, but we're here to simplify it.
Discover if Beijing Chunlizhengda Medical Instruments might be undervalued or overvalued with our detailed analysis, featuring fair value estimates, potential risks, dividends, insider trades, and its financial condition.
Access Free AnalysisHave feedback on this article? Concerned about the content? Get in touch with us directly. Alternatively, email editorial-team (at) simplywallst.com.
This article by Simply Wall St is general in nature. We provide commentary based on historical data and analyst forecasts only using an unbiased methodology and our articles are not intended to be financial advice. It does not constitute a recommendation to buy or sell any stock, and does not take account of your objectives, or your financial situation. We aim to bring you long-term focused analysis driven by fundamental data. Note that our analysis may not factor in the latest price-sensitive company announcements or qualitative material. Simply Wall St has no position in any stocks mentioned.
About SEHK:1858
Beijing Chunlizhengda Medical Instruments
An orthopedic medical device company, engages in the research and development, production, and trading of surgical implants, instruments, and related products in the People’s Republic of China.
Flawless balance sheet and undervalued.
