Stock Analysis
- Hong Kong
- /
- Oil and Gas
- /
- SEHK:956
China Suntien Green Energy (HKG:956) sheds 3.3% this week, as yearly returns fall more in line with earnings growth

Generally speaking the aim of active stock picking is to find companies that provide returns that are superior to the market average. And while active stock picking involves risks (and requires diversification) it can also provide excess returns. To wit, the China Suntien Green Energy share price has climbed 42% in five years, easily topping the market decline of 25% (ignoring dividends). On the other hand, the more recent gains haven't been so impressive, with shareholders gaining just 0.6% , including dividends .
Since the long term performance has been good but there's been a recent pullback of 3.3%, let's check if the fundamentals match the share price.
See our latest analysis for China Suntien Green Energy
To quote Buffett, 'Ships will sail around the world but the Flat Earth Society will flourish. There will continue to be wide discrepancies between price and value in the marketplace...' One imperfect but simple way to consider how the market perception of a company has shifted is to compare the change in the earnings per share (EPS) with the share price movement.
Over half a decade, China Suntien Green Energy managed to grow its earnings per share at 9.0% a year. The EPS growth is more impressive than the yearly share price gain of 7% over the same period. Therefore, it seems the market has become relatively pessimistic about the company. This cautious sentiment is reflected in its (fairly low) P/E ratio of 5.79.
The graphic below depicts how EPS has changed over time (unveil the exact values by clicking on the image).
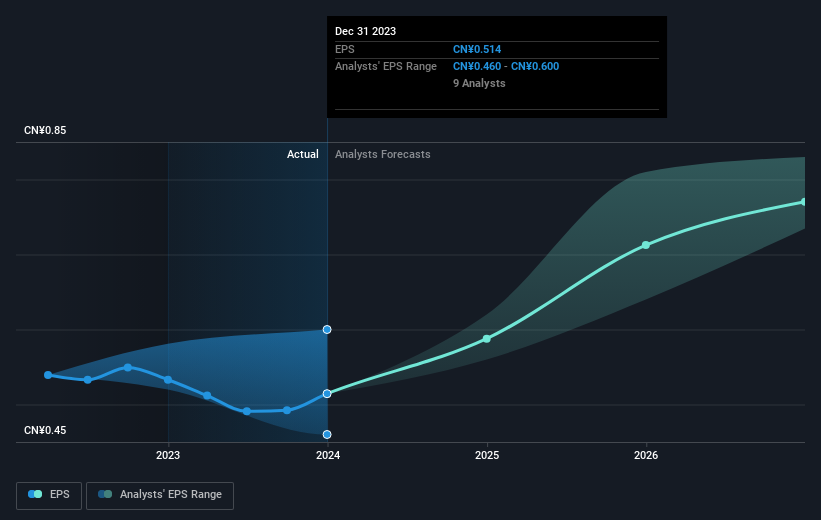
We're pleased to report that the CEO is remunerated more modestly than most CEOs at similarly capitalized companies. But while CEO remuneration is always worth checking, the really important question is whether the company can grow earnings going forward. Before buying or selling a stock, we always recommend a close examination of historic growth trends, available here..
What About Dividends?
When looking at investment returns, it is important to consider the difference between total shareholder return (TSR) and share price return. Whereas the share price return only reflects the change in the share price, the TSR includes the value of dividends (assuming they were reinvested) and the benefit of any discounted capital raising or spin-off. So for companies that pay a generous dividend, the TSR is often a lot higher than the share price return. In the case of China Suntien Green Energy, it has a TSR of 92% for the last 5 years. That exceeds its share price return that we previously mentioned. The dividends paid by the company have thusly boosted the total shareholder return.
A Different Perspective
We're pleased to report that China Suntien Green Energy shareholders have received a total shareholder return of 0.6% over one year. And that does include the dividend. Having said that, the five-year TSR of 14% a year, is even better. The pessimistic view would be that be that the stock has its best days behind it, but on the other hand the price might simply be moderating while the business itself continues to execute. It's always interesting to track share price performance over the longer term. But to understand China Suntien Green Energy better, we need to consider many other factors. Take risks, for example - China Suntien Green Energy has 2 warning signs (and 1 which can't be ignored) we think you should know about.
For those who like to find winning investments this free list of growing companies with recent insider purchasing, could be just the ticket.
Please note, the market returns quoted in this article reflect the market weighted average returns of stocks that currently trade on Hong Kong exchanges.
Valuation is complex, but we're helping make it simple.
Find out whether China Suntien Green Energy is potentially over or undervalued by checking out our comprehensive analysis, which includes fair value estimates, risks and warnings, dividends, insider transactions and financial health.
View the Free AnalysisHave feedback on this article? Concerned about the content? Get in touch with us directly. Alternatively, email editorial-team (at) simplywallst.com.
This article by Simply Wall St is general in nature. We provide commentary based on historical data and analyst forecasts only using an unbiased methodology and our articles are not intended to be financial advice. It does not constitute a recommendation to buy or sell any stock, and does not take account of your objectives, or your financial situation. We aim to bring you long-term focused analysis driven by fundamental data. Note that our analysis may not factor in the latest price-sensitive company announcements or qualitative material. Simply Wall St has no position in any stocks mentioned.
About SEHK:956
China Suntien Green Energy
China Suntien Green Energy Corporation Limited, together with its subsidiaries, develops and utilizes clean energy in Mainland China.
Fair value with moderate growth potential.
